
November 13, 2017 2017 Investor Day AerCap Holdings N.V.
This presentation contains certain statements, estimates and forecasts with respect to future performance and events. These statements, estimates and forecasts are “forward-looking statements”. In some cases, forward-looking statements can be identified by the use of forward-looking terminology such as “may,” “might,” “should,” “expect,” “plan,” “intend,” “estimate,” “anticipate,” “believe,” “predict,” “potential” or “continue” or the negatives thereof or variations thereon or similar terminology. All statements other than statements of historical fact included in this presentation are forward-looking statements and are based on various underlying assumptions and expectations and are subject to known and unknown risks, uncertainties and assumptions and may include projections of our future financial performance based on our growth strategies and anticipated trends in our business. These statements are only predictions based on our current expectations and projections about future events. There are important factors that could cause our actual results, level of activity, performance or achievements to differ materially from the results, level of activity, performance or achievements expressed or implied in the forward-looking statements. As a result, we cannot assure you that the forward-looking statements included in this presentation will prove to be accurate or correct. In light of these risks, uncertainties and assumptions, the future performance or events described in the forward-looking statements in this presentation might not occur. Accordingly, you should not rely upon forward-looking statements as a prediction of actual results and we do not assume any responsibility for the accuracy or completeness of any of these forward-looking statements. Except as required by applicable law, we do not undertake any obligation to, and will not, update any forward-looking statements, whether as a result of new information, future events or otherwise.No warranty or representation is given concerning such information, which must not be taken as establishing any contractual or other commitment binding upon AerCap Holdings N.V. or any of its subsidiaries or associated companies.In addition to presenting financial results in conformity with U.S. generally accepted accounting principles (“GAAP“), this presentation includes certain non-GAAP financial measures. Reconciliations of such non-GAAP financial measures are set forth or referred to in the presentation where relevant. Non- GAAP financial measures should be considered in addition to, not as a substitute for or superior to, financial measures determined in conformity with GAAP.Due to rounding, numbers presented throughout this document may not add up precisely to the totals provided and percentages may not precisely reflect the absolute figures. Disclaimer Incl. Forward Looking Statements & Safe Harbor 2
Agenda | Introduction Brian Canniffe Head of Investor Relations | AerCap Update Aengus Kelly Chief Executive Officer | Leasing Philip Scruggs President & Chief Commercial Officer 3
Agenda | Portfolio Management Edward O’Byrne Chief Investment Officer | Financial Performance Peter Juhas Chief Financial Officer | Q&A and Closing Remarks 4
AerCap Update Aengus Kelly Chief Executive Officer
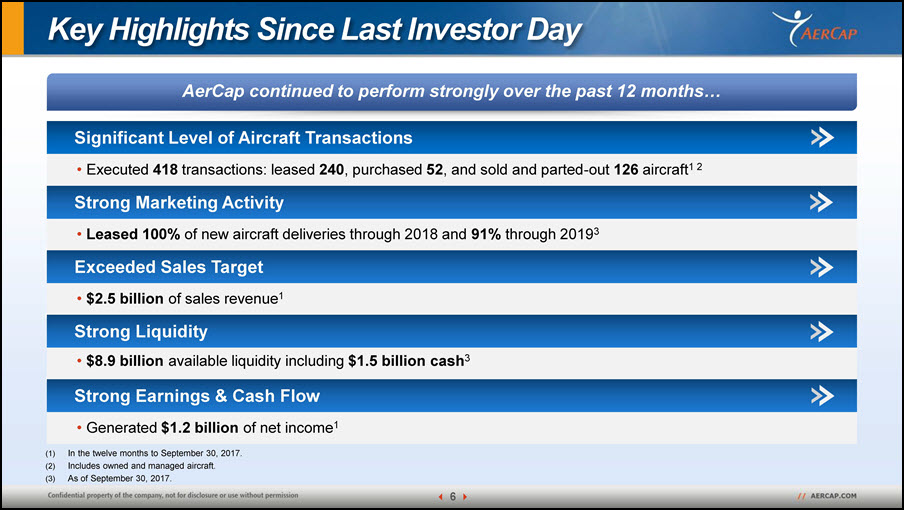
Key Highlights Since Last Investor Day AerCap continued to perform strongly over the past 12 months… Significant Level of Aircraft Transactions Executed 418 transactions: leased 240, purchased 52, and sold and parted-out 126 aircraft12 Strong Marketing Activity Leased 100% of new aircraft deliveries through 2018 and 91% through 20193 Exceeded Sales Target $2.5 billion of sales revenue1 Strong Liquidity $8.9 billion available liquidity including $1.5 billion cash3 Strong Earnings & Cash FlowGenerated $1.2 billion of net income1 In the twelve months to September 30, 2017.Includes owned and managed aircraft.As of September 30, 2017. 6
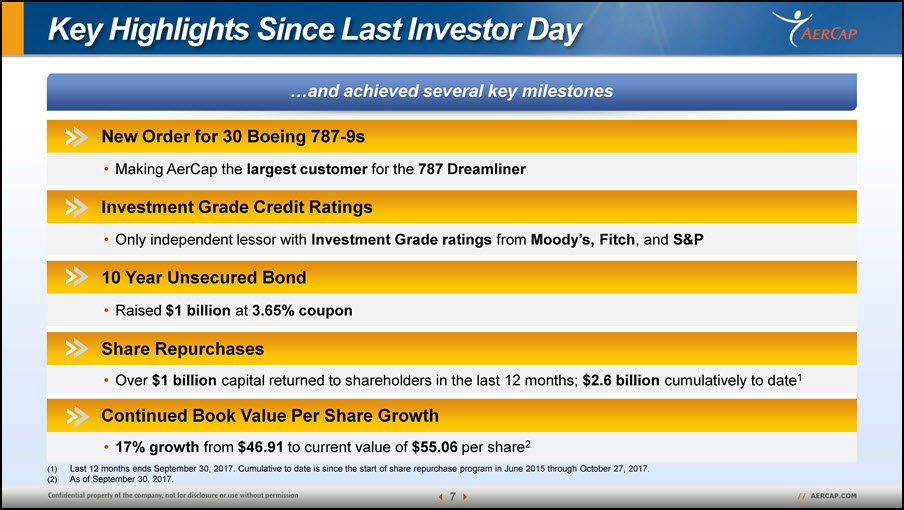
Key Highlights Since Last Investor Day …and achieved several key milestones New Order for 30 Boeing 787-9sMaking AerCap the largest customer for the 787 Dreamliner Investment Grade Credit RatingsOnly independent lessor with Investment Grade ratings from Moody’s, Fitch, and S&P 10 Year Unsecured Bond Raised $1 billion at 3.65% coupon Share Repurchases Over $1 billion capital returned to shareholders in the last 12 months; $2.6 billion cumulatively to date1 Continued Book Value Per Share Growth 17% growth from $46.91 to current value of $55.06 per share2 Last 12 months ends September 30, 2017. Cumulative to date is since the start of share repurchase program in June 2015 through October 27, 2017.As of September 30, 2017. 7
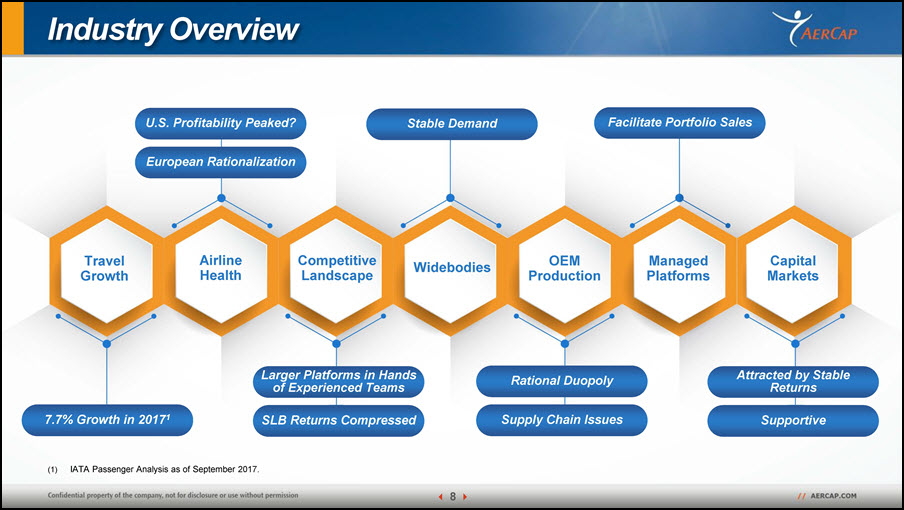
Industry Overview Travel Growth OEMProduction Managed Platforms Widebodies Airline Health Competitive Landscape Capital Markets Stable Demand European Rationalization U.S. Profitability Peaked? (1) IATA Passenger Analysis as of September 2017. Stable Demand Facilitate Portfolio Sales 7.7% Growth in 20171 SLB Returns Compressed Larger Platforms in Hands of Experienced Teams Supply Chain Issues Rational Duopoly Supportive Attracted by Stable Returns 8
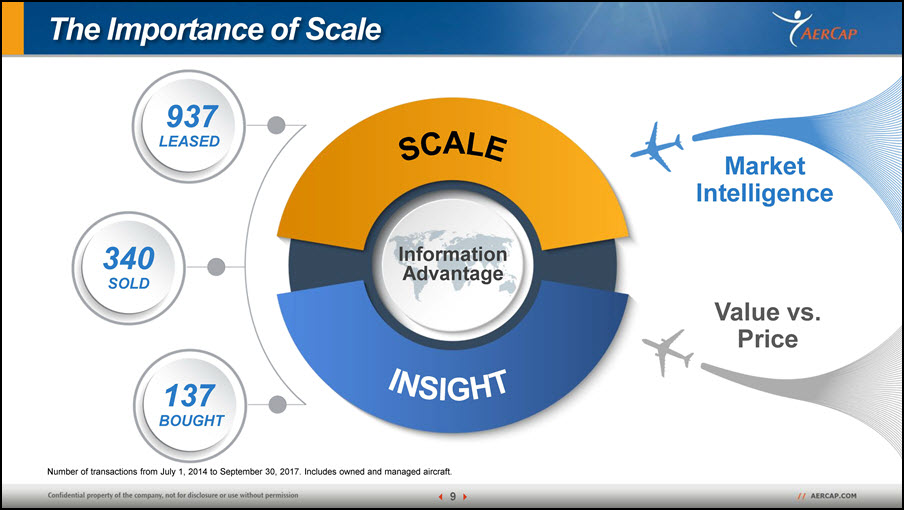
The Importance of Scale Scale Insight Information Advantage 937 LEASED 137 BOUGHT 340 SOLD Market Intelligence 9 Value vs. Price Number of transactions from July 1, 2014 to September 30, 2017. Includes owned and managed aircraft.
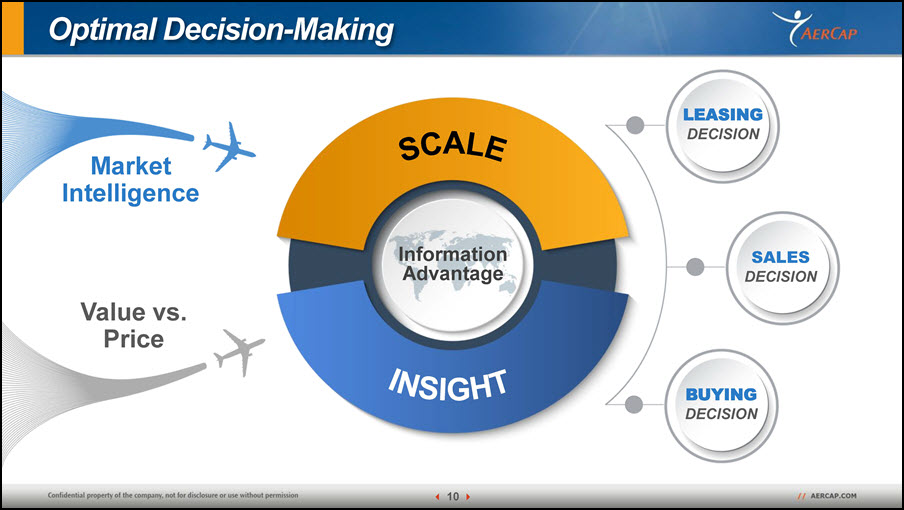
Optimal Decision-Making Scale Insight Information Advantage Market Intelligence Value vs. Price LEASING DECISION 10 BUYING DECISION SALES DECISION
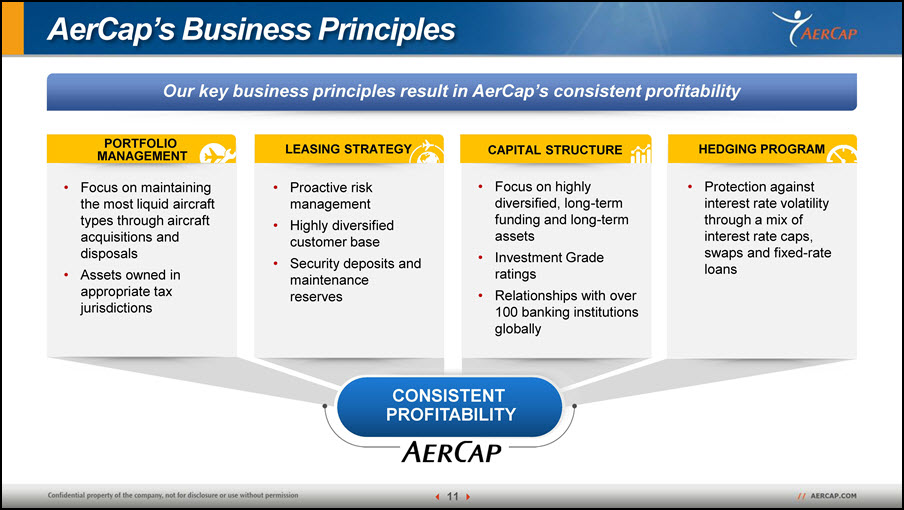
AerCap’s Business Principles Our key business principles result in AerCap’s consistent profitability Focus on maintaining the most liquid aircraft types through aircraft acquisitions and disposals Assets owned in appropriate tax jurisdictions Proactive riskmanagement Highly diversified customer baseSecurity deposits and maintenance reserves Focus on highly diversified, long-term funding and long-term assets Investment Grade ratingsRelationships with over 100 banking institutions globally Protection against interest rate volatility through a mix of interest rate caps, swaps and fixed-rate loans PORTFOLIO MANAGEMENT LEASING STRATEGY CAPITAL STRUCTURE HEDGING PROGRAM CONSISTENT PROFITABILITY 11
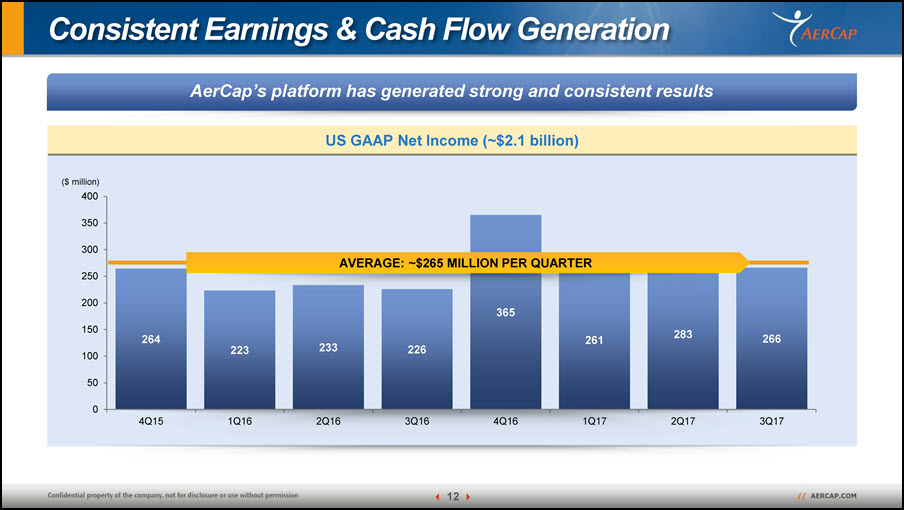
264 223 233 226 365 261 283 266 50 0 100 150 250 200 4Q15 1Q16 2Q16 3Q16 4Q16 1Q17 2Q17 3Q17 ($ million) 400 350 300 AVERAGE: ~$265 MILLION PER QUARTER AerCap’s platform has generated strong and consistent results US GAAP Net Income (~$2.1 billion) Consistent Earnings & Cash Flow Generation 12
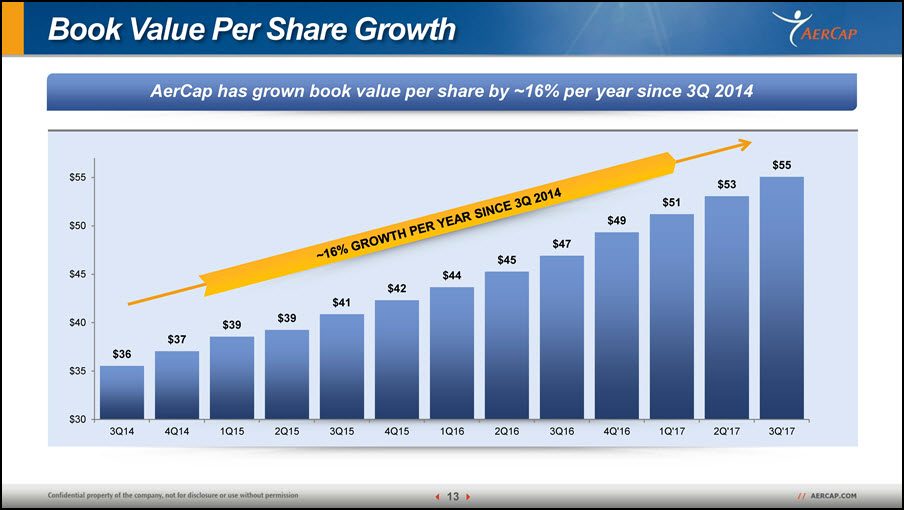
Book Value Per Share Growth AerCap has grown book value per share by ~16% per year since 3Q 2014 $39 $39 $42$41 $44 $47$45 $49 $51 $53 $55 $30 $37 $36$35 $40 $45 $50 $55 3Q14 4Q14 1Q15 2Q15 3Q15 4Q15 1Q16 2Q16 3Q16 4Q'16 1Q'17 2Q'17 3Q'17 13
Conclusions Strong Demand for Aircraft Due to High Travel Growth Scale is a Competitive Advantage Positive Outlook for AerCap 14
Leasing Philip ScruggsPresident & Chief Commercial Officer
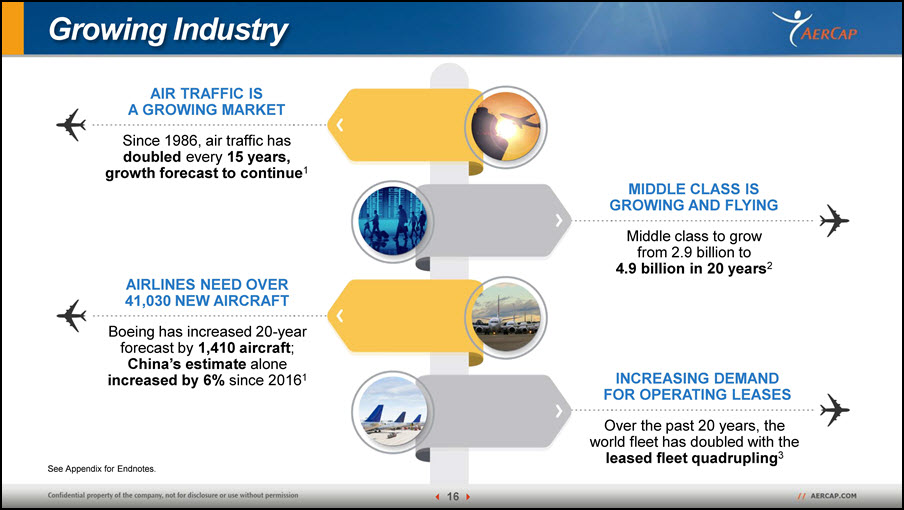
Growing Industry AIR TRAFFIC IS A GROWING MARKET Since 1986, air traffic has doubled every 15 years, growth forecast to continue1 16 AIRLINES NEED OVER 41,030 NEW AIRCRAFT Boeing has increased 20-year forecast by 1,410 aircraft; China’s estimate alone increased by 6% since 20161 MIDDLE CLASS ISGROWING AND FLYING Middle class to grow from 2.9 billion to 4.9 billion in 20 years2 INCREASING DEMAND FOR OPERATING LEASES Over the past 20 years, the world fleet has doubled with the leased fleet quadrupling3 See Appendix for Endnotes.
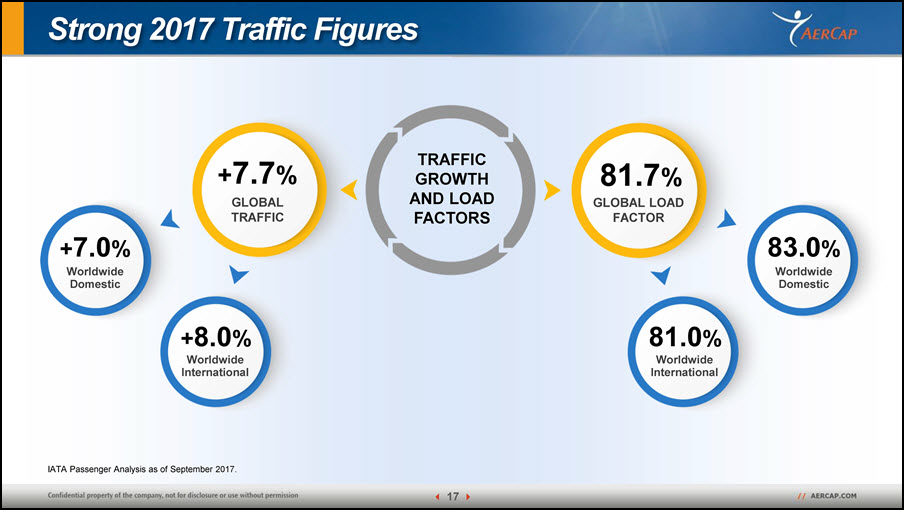
IATA Passenger Analysis as of September 2017. Strong 2017 Traffic Figures TRAFFIC GROWTH AND LOAD FACTORS 17 +7.7% GLOBAL TRAFFIC 81.7% GLOBAL LOAD FACTOR +7.0% Worldwide Domestic +8.0% Worldwide International 83.0% Worldwide Domestic 81.0% Worldwide International
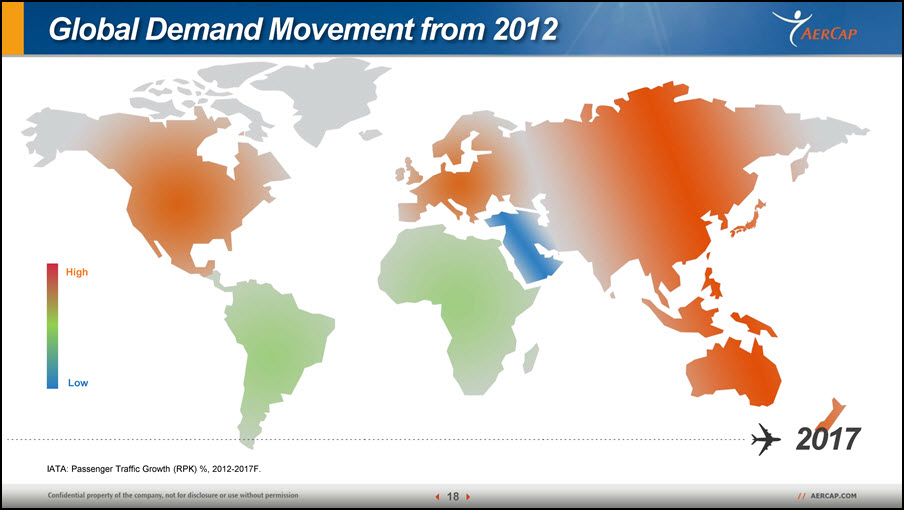
Global Demand Movement from 2012 2017 IATA: Passenger Traffic Growth (RPK) %, 2012-2017F. High Low 18
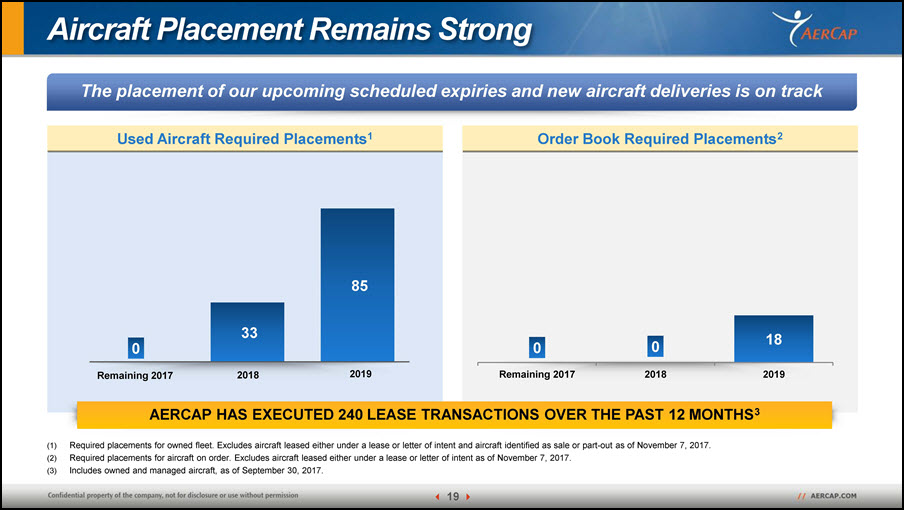
Order Book Required Placements2 Used Aircraft Required Placements1 Aircraft Placement Remains Strong The placement of our upcoming scheduled expiries and new aircraft deliveries is on track AERCAP HAS EXECUTED 240 LEASE TRANSACTIONS OVER THE PAST 12 MONTHS3 2018 2019 18 0 Remaining 2017 02018 2019 0Remaining 2017 33 85 Required placements for owned fleet. Excludes aircraft leased either under a lease or letter of intent and aircraft identified as sale or part-out as of November 7, 2017.Required placements for aircraft on order. Excludes aircraft leased either under a lease or letter of intent as of November 7, 2017.Includes owned and managed aircraft, as of September 30, 2017. 19
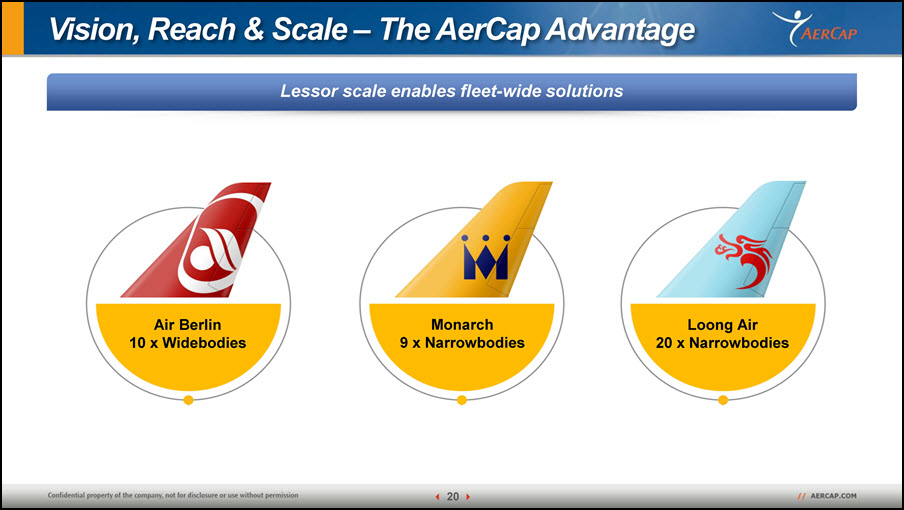
Vision, Reach & Scale – The AerCap Advantage Lessor scale enables fleet-wide solutions Air Berlin 10 x Widebodies Monarch 9 x Narrowbodies Loong Air 20 x Narrowbodies 20
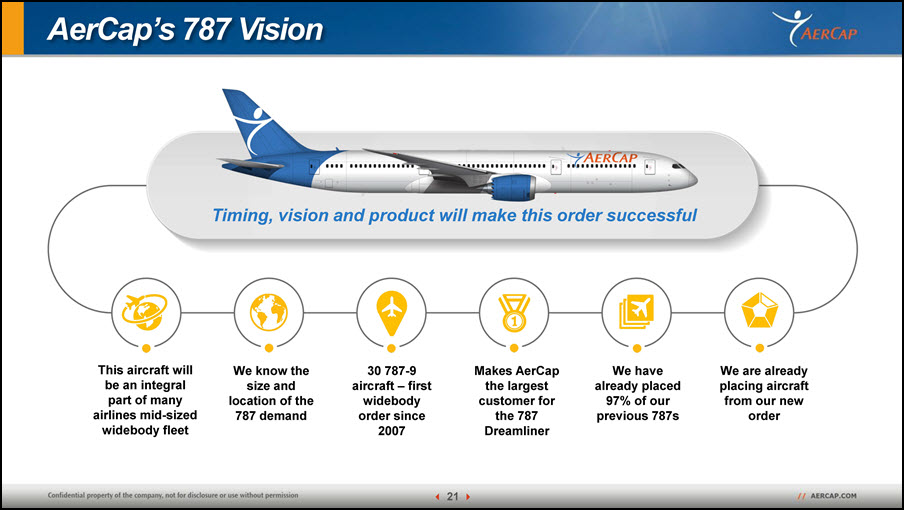
AerCap’s 787 Vision 30 787-9aircraft – first widebody order since 2007 We have already placed 97% of our previous 787s This aircraft will be an integral part of many airlines mid-sized widebody fleet We know the size and location of the 787 demand Makes AerCap the largest customer for the 787 Dreamliner We are already placing aircraft from our new order Timing, vision and product will make this order successful 21
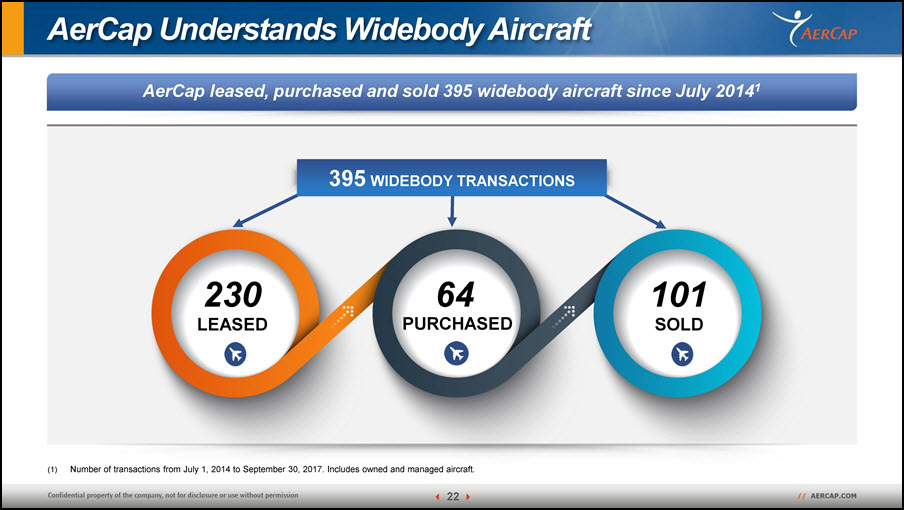
AerCap leased, purchased and sold 395 widebody aircraft since July 20141 (1) Number of transactions from July 1, 2014 to September 30, 2017. Includes owned and managed aircraft. AerCap Understands Widebody Aircraft 395 WIDEBODY TRANSACTIONS 230 LEASED 64 PURCHASED 101 SOLD 22
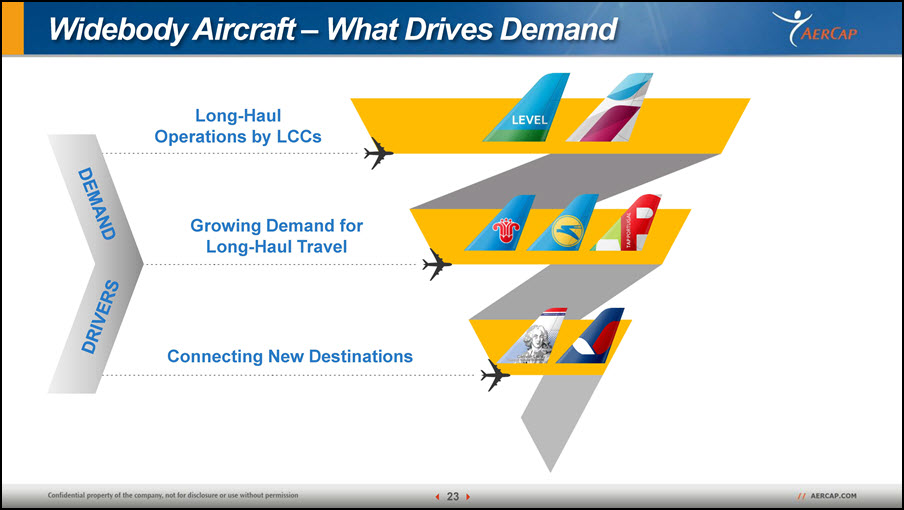
Widebody Aircraft – What Drives Demand Long-Haul Operations by LCCs Growing Demand for Long-Haul Travel Connecting New Destinations 23
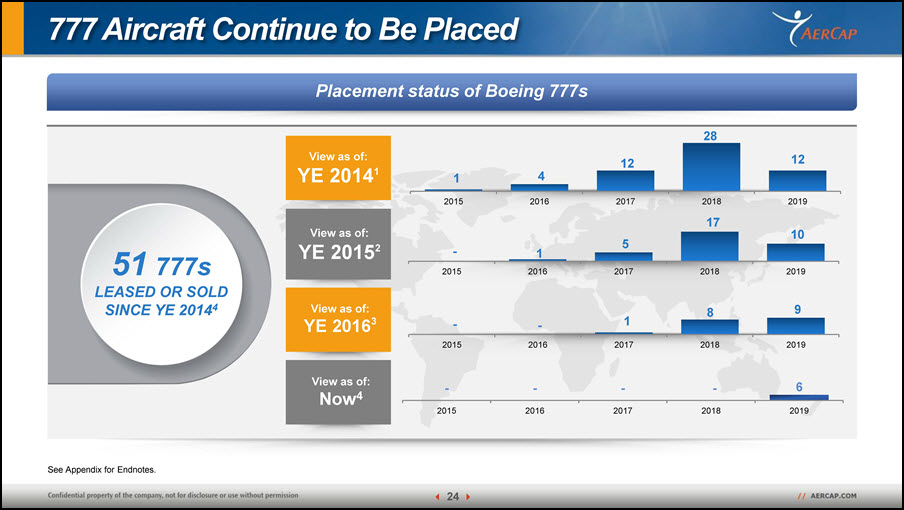
Placement status of Boeing 777s 777 Aircraft Continue to Be Placed 51 777s LEASED OR SOLD SINCE YE 20144 - 1 5 17 10 2015 2016 2017 2018 2019 1 4 12 28 12 2015 2016 2017 2018 2019 - - - - 6 2015 2016 2017 2018 2019 - - 1 8 9 2015 2016 2017 2018 2019 View as of: YE 20163 24 View as of: YE 20152 View as of: YE 20141 View as of: Now4 See Appendix for Endnotes.
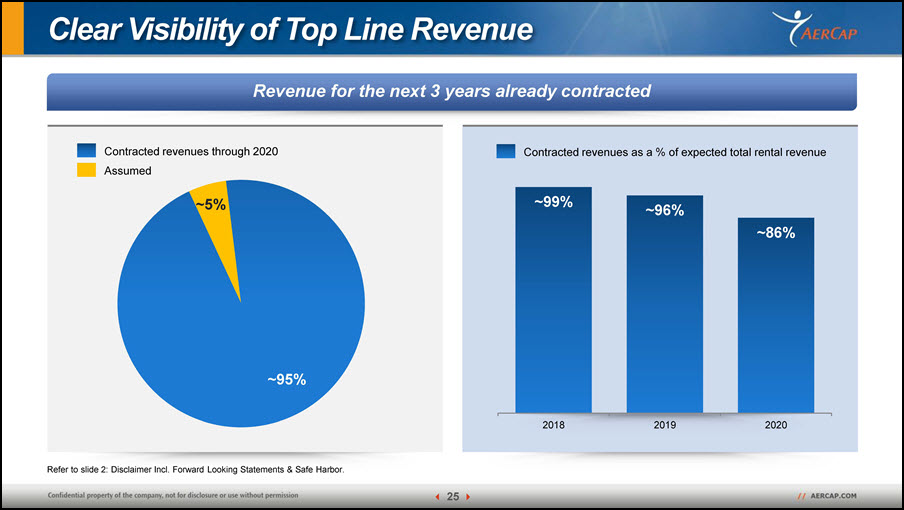
Clear Visibility of Top Line Revenue Revenue for the next 3 years already contracted Contracted revenues as a % of expected total rental revenue Contracted revenues through 2020 Assumed~5%~95% ~99% 25 ~96% ~86% 2018 2019 2020 Refer to slide 2: Disclaimer Incl. Forward Looking Statements & Safe Harbor.
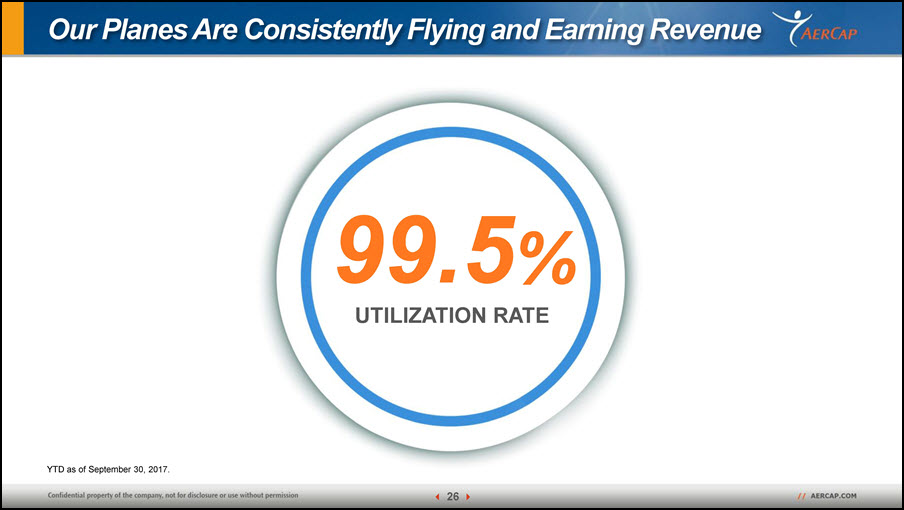
99.5% UTILIZATION RATE YTD as of September 30, 2017. Our Planes Are Consistently Flying and Earning Revenue 26
Conclusions Strong Demand for Aircraft Scale is a Competitive Advantage Clear Visibility of Future Revenue 27
Edward O’Byrne Chief Investment Officer Portfolio Management
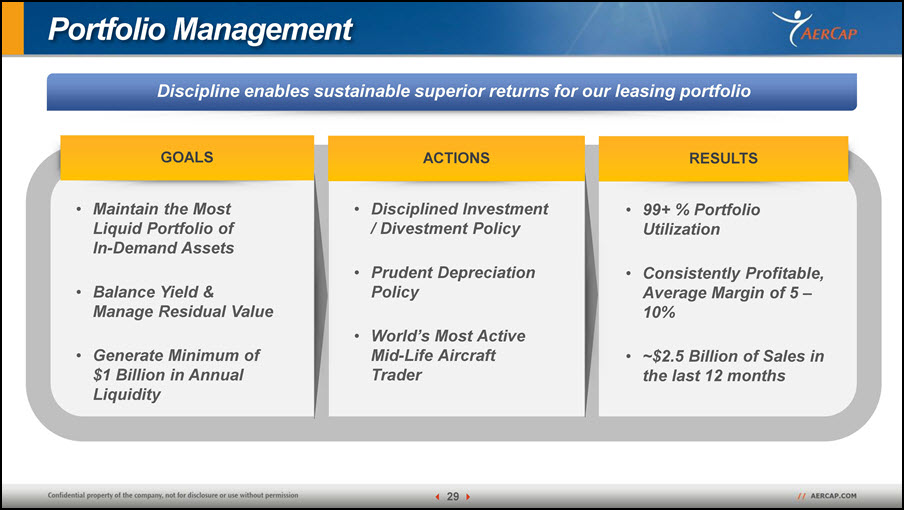
Portfolio Management Discipline enables sustainable superior returns for our leasing portfolio Maintain the Most Liquid Portfolio of In-Demand Assets Balance Yield & Manage Residual Value Generate Minimum of$1 Billion in Annual Liquidity GOALS RESULTS 99+ % Portfolio Utilization Consistently Profitable, Average Margin of 5 – 10% ~$2.5 Billion of Sales in the last 12 months Disciplined Investment / Divestment Policy Prudent Depreciation Policy World’s Most Active Mid-Life Aircraft Trader ACTIONS 29
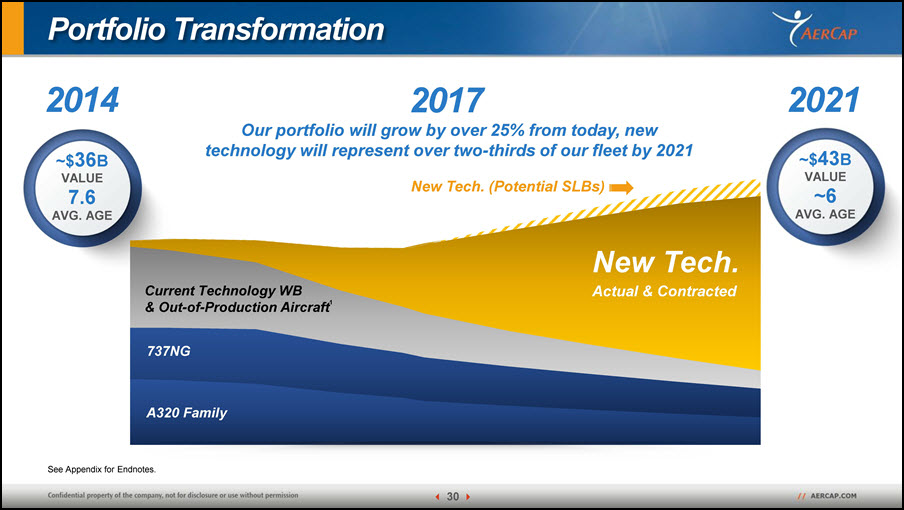
~$36B VALUE 7.6 AVG. AGE Portfolio Transformation 2014 2021 ~$43B VALUE ~6 AVG. AGE A320 Family 737NG Current Technology WB& Out-of-Production Aircraft1 New Tech.Actual & Contracted See Appendix for Endnotes. New Tech. (Potential SLBs) 2017 Our portfolio will grow by over 25% from today, new technology will represent over two-thirds of our fleet by 2021 30
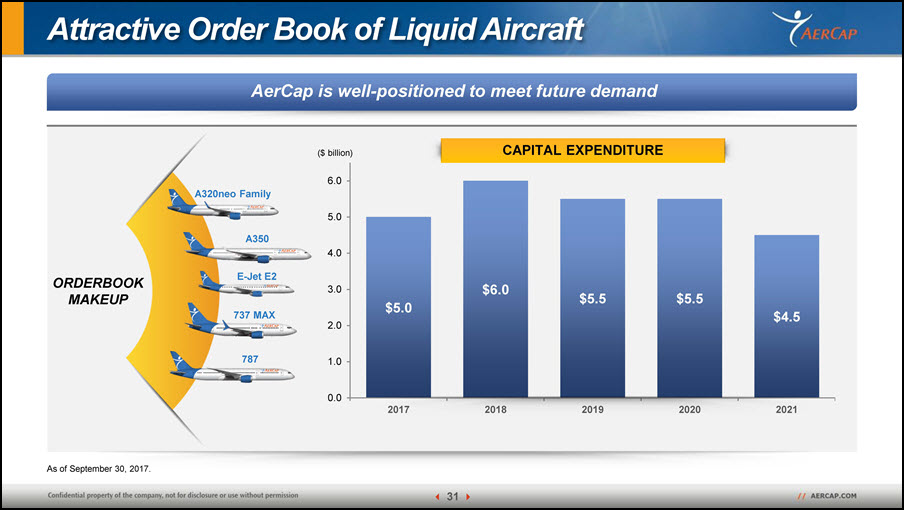
Attractive Order Book of Liquid Aircraft AerCap is well-positioned to meet future demand ORDERBOOK MAKEUP $5.0 $6.0 $5.5 $5.5 $4.5 0.0 1.0 2.0 3.0 2017 2018 2019 2020 2021 737 MAX 787 E-Jet E2 6.0 A320neo Family 5.0 A350 4.0 ($ billion) CAPITAL EXPENDITURE As of September 30, 2017. 31
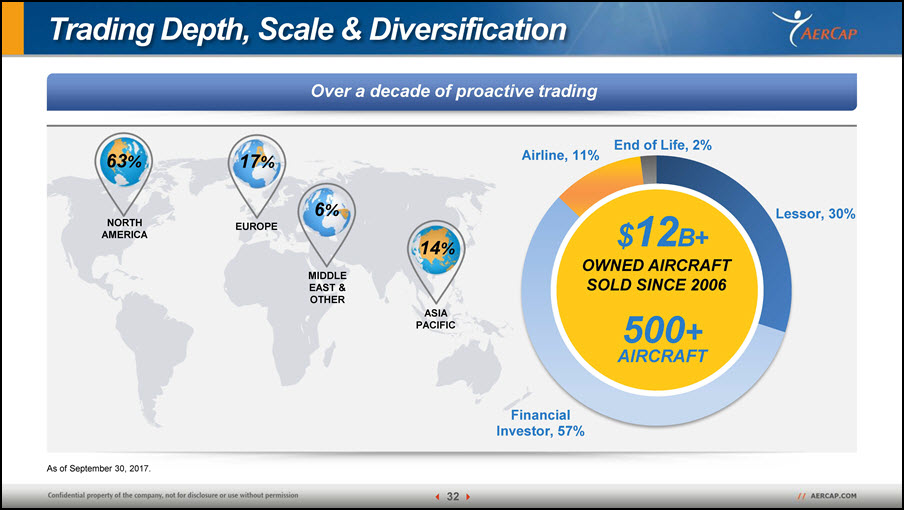
Trading Depth, Scale & Diversification Lessor, 30% Financial Investor, 57% Airline, 11% End of Life, 2% $12B+ OWNED AIRCRAFT SOLD SINCE 2006 500+ AIRCRAFT 14% ASIA PACIFIC 6% MIDDLE EAST & OTHER 17% EUROPE 63% NORTH AMERICA Over a decade of proactive trading As of September 30, 2017. 32
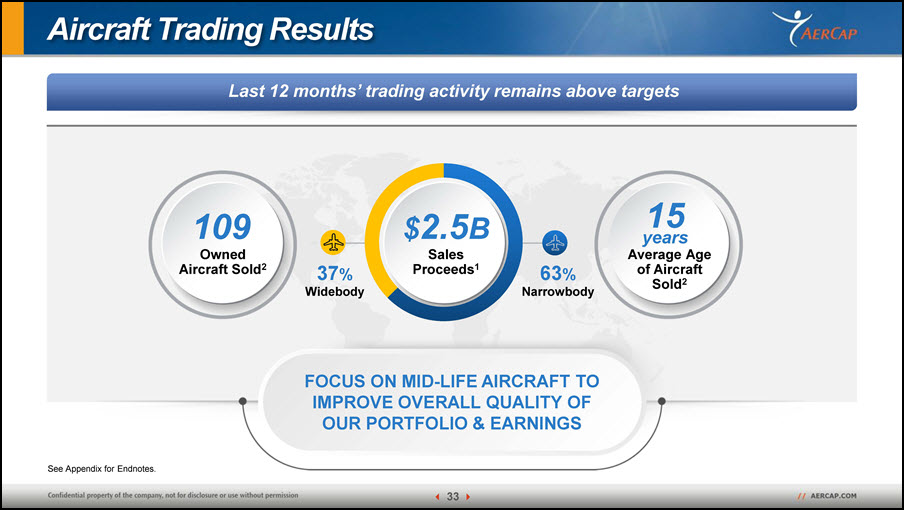
Aircraft Trading Results FOCUS ON MID-LIFE AIRCRAFT TO IMPROVE OVERALL QUALITY OF OUR PORTFOLIO & EARNINGS $2.5B Sales Proceeds1 15 years Average Age of Aircraft Sold2 109 Owned Aircraft Sold2 37% Widebody 63% Narrowbody Last 12 months’ trading activity remains above targets See Appendix for Endnotes. 33
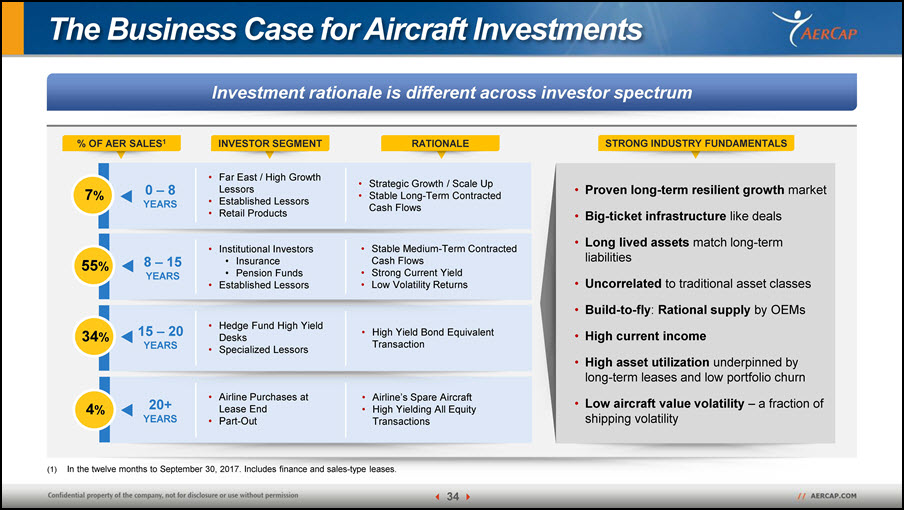
0 – 8 YEARS 7% Far East / High Growth LessorsEstablished Lessors Retail Products Strategic Growth / Scale Up Stable Long-Term Contracted Cash Flows The Business Case for Aircraft Investments Investment rationale is different across investor spectrum INVESTOR SEGMENT RATIONALE % OF AER SALES1 20+ YEARS 4% Airline Purchases at Lease End Part-Out 15 – 20 YEARS 34% Hedge Fund High Yield Desks Specialized Lessors High Yield Bond Equivalent Transaction 8 – 15 YEARS 55% Institutional InvestorsInsurancePension Funds Established Lessors Stable Medium-Term Contracted Cash FlowsStrong Current Yield Low Volatility Returns STRONG INDUSTRY FUNDAMENTALS Proven long-term resilient growth marketBig-ticket infrastructure like deals Long lived assets match long-term liabilities Uncorrelated to traditional asset classes Build-to-fly: Rational supply by OEMs High current income High asset utilization underpinned by long-term leases and low portfolio churn Low aircraft value volatility – a fraction of shipping volatility Airline’s Spare Aircraft High Yielding All Equity Transactions (1) In the twelve months to September 30, 2017. Includes finance and sales-type leases. 34
Key Investment Themes
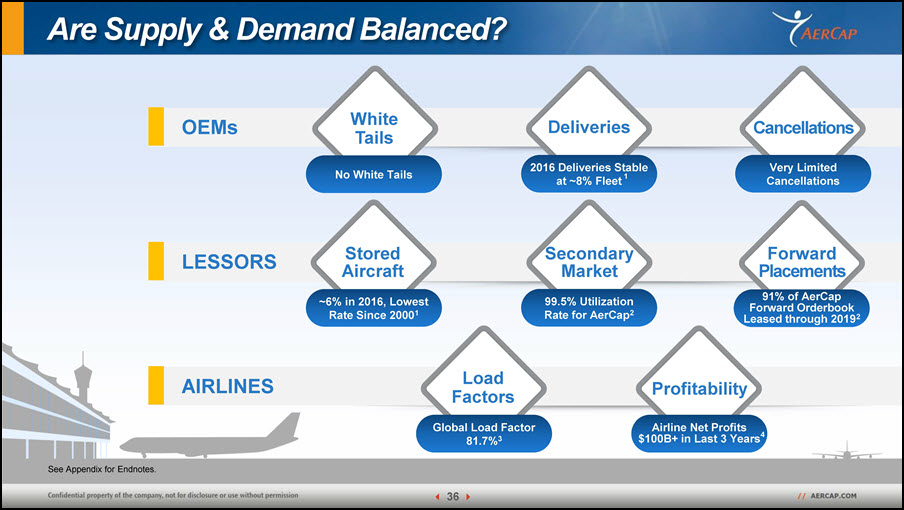
OEMs AIRLINES Are Supply & Demand Balanced? Load Factors Global Load Factor 81.7%3 Profitability LESSORS Stored Aircraft ~6% in 2016, Lowest Rate Since 20001 Secondary Market 99.5% Utilization Rate for AerCap2 See Appendix for Endnotes. White Tails No White Tails Very LimitedCancellations Cancellations Deliveries Forward Placements 36 91% of AerCap Leased through 2019 Forward Orderbook2 Airline Net Profits $100B+ in Last 3 Years4 2016 Deliveries Stable at ~8% Fleet 1
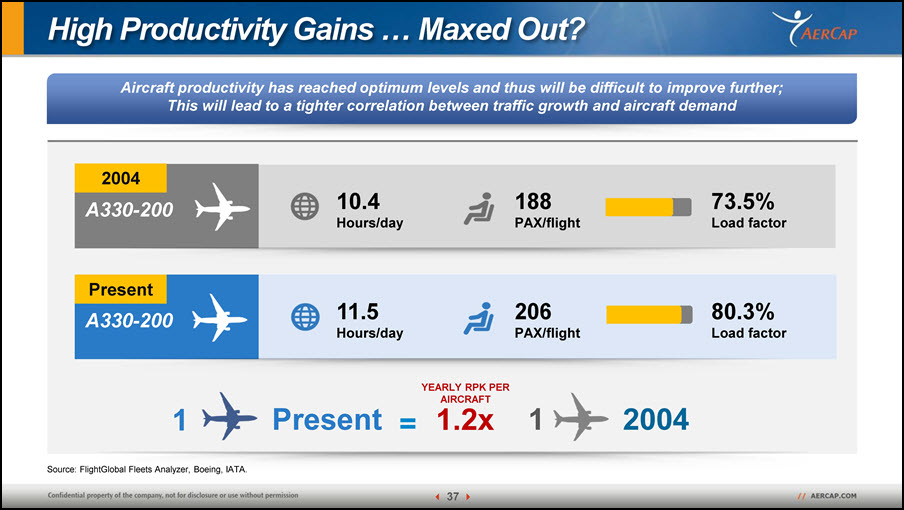
High Productivity Gains … Maxed Out? 10.4 Hours/day 188PAX/flight 73.5% Load factor 11.5Hours/day 206 PAX/flight 80.3% Load factor 2004 2004 Present A330-200 A330-200 1 YEARLY RPK PER AIRCRAFT Present = 1.2x 1 Source: FlightGlobal Fleets Analyzer, Boeing, IATA. Aircraft productivity has reached optimum levels and thus will be difficult to improve further; This will lead to a tighter correlation between traffic growth and aircraft demand 37
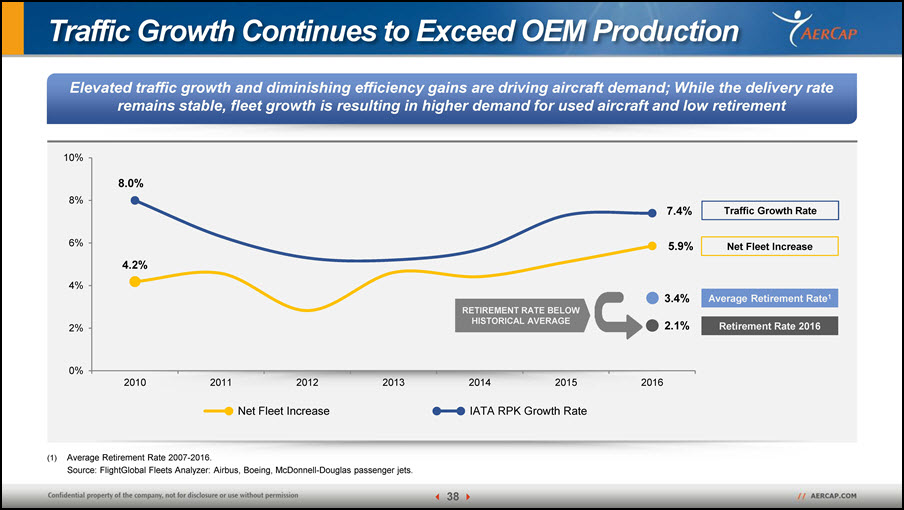
Traffic Growth Continues to Exceed OEM Production Net Fleet Increase Elevated traffic growth and diminishing efficiency gains are driving aircraft demand; While the delivery rateremains stable, fleet growth is resulting in higher demand for used aircraft and low retirement 5.9% 7.4% 3.4% 2.1% 0% 2% 4.2% 4% 6% 8% 10% 8.0% 2010 2011 2012 2013 2016 Net Fleet Increase 2014 2015IATA RPK Growth Rate Traffic Growth Rate Retirement Rate 2016 Average Retirement Rate1 RETIREMENT RATE BELOW HISTORICAL AVERAGE (1) Average Retirement Rate 2007-2016.Source: FlightGlobal Fleets Analyzer: Airbus, Boeing, McDonnell-Douglas passenger jets. 38
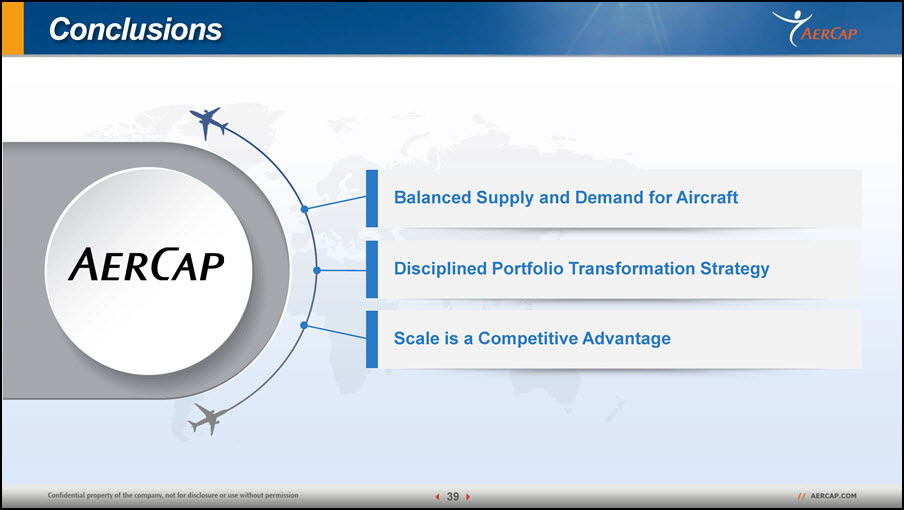
Conclusions Balanced Supply and Demand for Aircraft Disciplined Portfolio Transformation Strategy Scale is a Competitive Advantage 39
Financial Performance Peter Juhas Chief Financial Officer
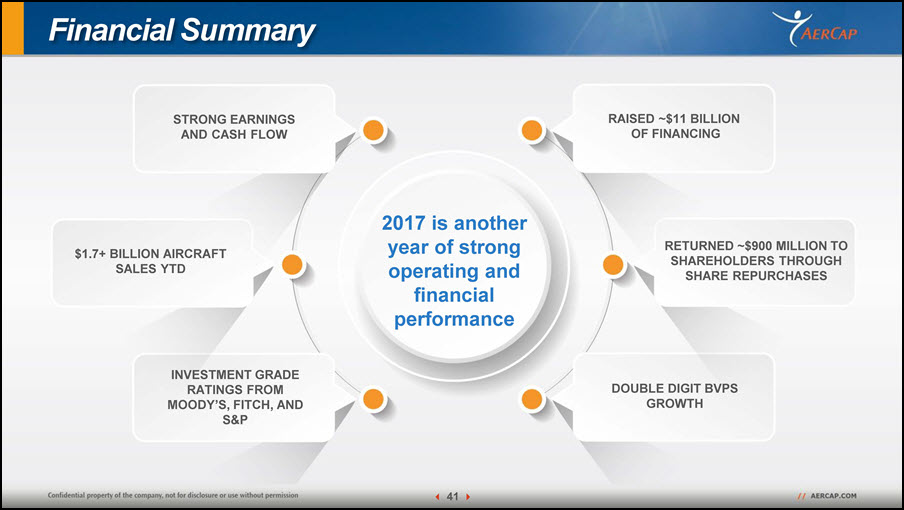
Financial Summary 41 2017 is another year of strong operating and financial performance STRONG EARNINGS AND CASH FLOW $1.7+ BILLION AIRCRAFT SALES YTD INVESTMENT GRADE RATINGS FROM MOODY’S, FITCH, AND S&P RAISED ~$11 BILLION OF FINANCING RETURNED ~$900 MILLION TO SHAREHOLDERS THROUGH SHARE REPURCHASES DOUBLE DIGIT BVPS GROWTH
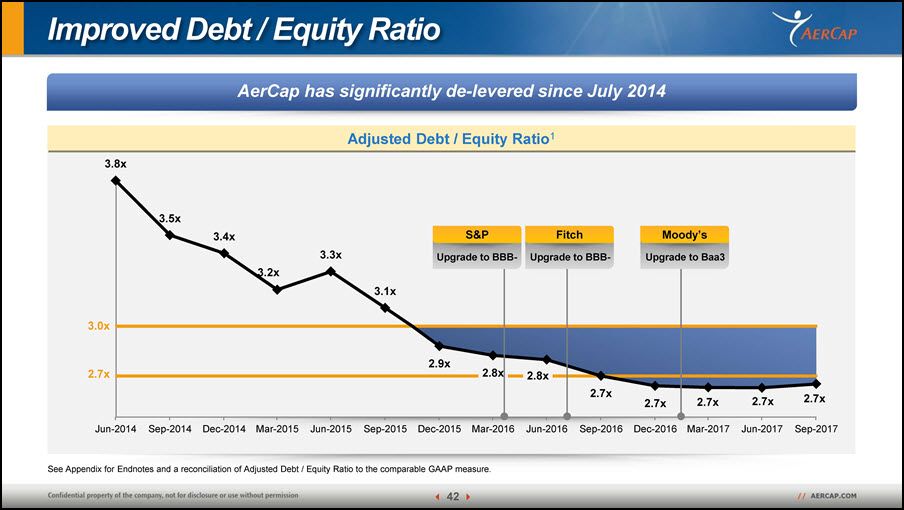
Improved Debt / Equity Ratio AerCap has significantly de-levered since July 2014Adjusted Debt / Equity Ratio1 3.8x 3.5x 3.4x 3.2x 3.3x 3.1x 2.9x 2.8x 2.8x 2.7x 2.7x 2.7x Jun-2014 Sep-2014 Dec-2014 Mar-2015 Jun-2015 Sep-2015 Dec-2015 Mar-2016 Jun-2016 Sep-2016 2.7x 2.7xDec-2016 Mar-2017 Jun-2017 Sep-2017 3.0x 2.7x S&P Upgrade to BBB- FitchUpgrade to BBB- Moody’s Upgrade to Baa3 See Appendix for Endnotes and a reconciliation of Adjusted Debt / Equity Ratio to the comparable GAAP measure. 42
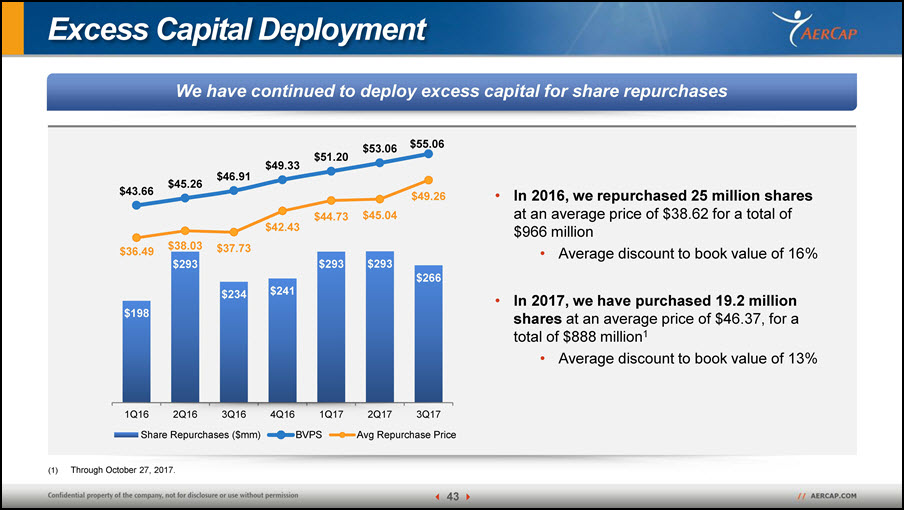
Excess Capital Deployment $198 $293 $234 $241 $293 $293 $266 $43.66 $45.26 $46.91 $49.33 $51.20 $53.06 $55.06 $36.49 $38.03 $37.73 $42.43 $44.73 $45.04 $49.26 4Q16 1Q17 1Q16 2Q16 3Q16 Share Repurchases ($mm) BVPS 2Q17 3Q17 Avg Repurchase Price In 2016, we repurchased 25 million shares at an average price of $38.62 for a total of $966 millionAverage discount to book value of 16% In 2017, we have purchased 19.2 million shares at an average price of $46.37, for a total of $888 million1 Average discount to book value of 13% We have continued to deploy excess capital for share repurchases (1) Through October 27, 2017. 43
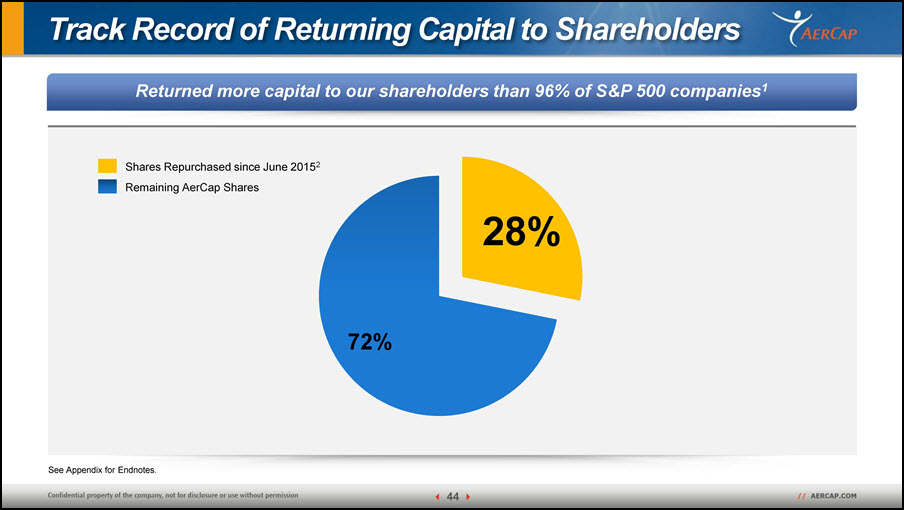
Track Record of Returning Capital to Shareholders 28% 72% Shares Repurchased since June 20152 Remaining AerCap Shares Returned more capital to our shareholders than 96% of S&P 500 companies1 See Appendix for Endnotes. 44
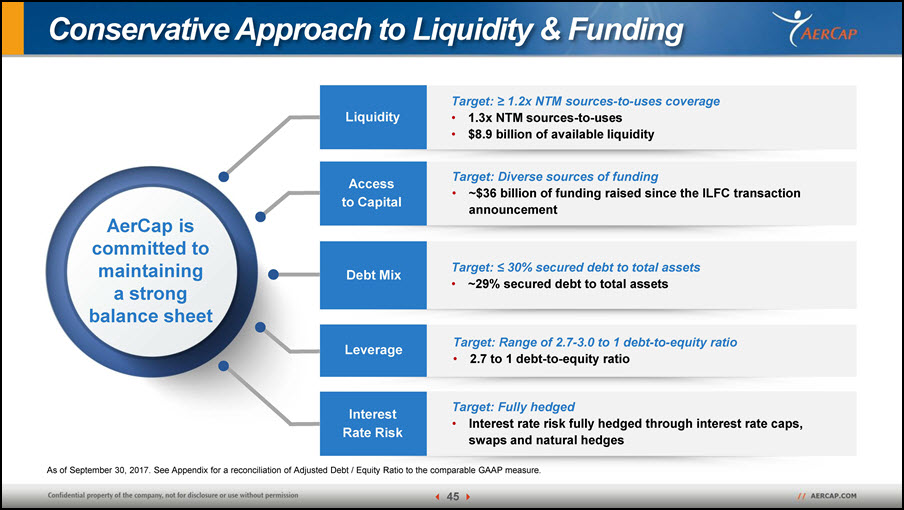
Conservative Approach to Liquidity & Funding AerCap is committed to maintaining a strongbalance sheet Liquidity Target: ≥ 1.2x NTM sources-to-uses coverage1.3x NTM sources-to-uses $8.9 billion of available liquidity As of September 30, 2017. See Appendix for a reconciliation of Adjusted Debt / Equity Ratio to the comparable GAAP measure. Accessto Capital Target: Diverse sources of funding ~$36 billion of funding raised since the ILFC transaction announcement Debt Mix Target: ≤ 30% secured debt to total assets ~29% secured debt to total assets Leverage Target: Range of 2.7-3.0 to 1 debt-to-equity ratio2.7 to 1 debt-to-equity ratio Interest Rate Risk Target: Fully hedged Interest rate risk fully hedged through interest rate caps, swaps and natural hedges 45
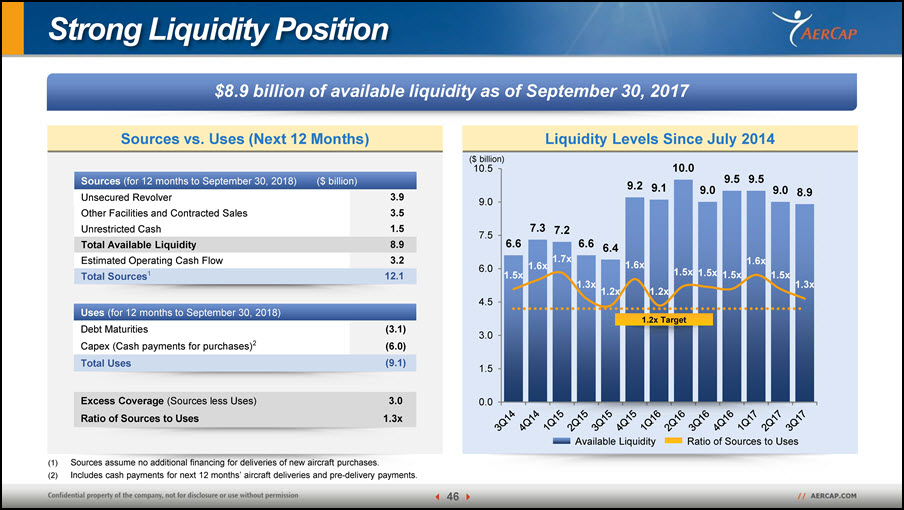
6.6 7.3 7.2 6.6 6.4 9.2 9.1 10.0 9.5 9.59.0 9.0 8.9 1.6x1.5x 1.7x 1.3x 1.2x 1.6x 1.2x 1.5x 1.5x 1.5x 1.6x 1.5x 1.3x 0.0x 0.2x 0.4x 0.6x 0.8x 1.0x 1.2x 1.4x 1.6x 1.8x 2.0x 2.2x 2.4x 2.6x 2.8x 3.0x 0.0 1.5 3.0 4.5 6.0 7.5 9.0 Strong Liquidity Position Sources (for 12 months to September 30, 2018) ($ billion)Unsecured Revolver 3.9Other Facilities and Contracted Sales 3.5Unrestricted Cash 1.5Total Available Liquidity 8.9Estimated Operating Cash Flow 3.2Total Sources1 12.1 Liquidity Levels Since July 2014 Sources vs. Uses (Next 12 Months) Sources assume no additional financing for deliveries of new aircraft purchases.Includes cash payments for next 12 months’ aircraft deliveries and pre-delivery payments. Uses (for 12 months to September 30, 2018) Debt Maturities (3.1) Capex (Cash payments for purchases)2 (6.0) Total Uses (9.1) Excess Coverage (Sources less Uses) 3.0 Ratio of Sources to Uses 1.3x ($ billion)10.5 Available Liquidity Ratio of Sources to Uses 1.2x Target $8.9 billion of available liquidity as of September 30, 2017 Sources (for 12 months to September 30, 2018) ($ billion) 46 Unsecured RevolverOther Facilities and Contracted Sales Unrestricted Cash 3.9 3.5 1.5 Total Available Liquidity 8.9 Estimated Operating Cash Flow 3.2 Total Sources1 12.1
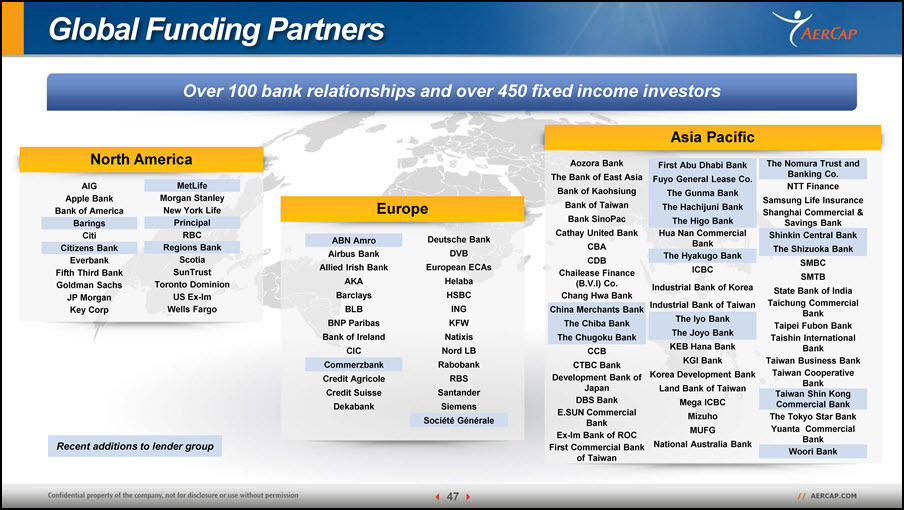
Global Funding Partners Over 100 bank relationships and over 450 fixed income investors North America AIG Apple Bank Bank of America Barings Citi Citizens Bank Everbank Fifth Third Bank Goldman Sachs JP Morgan Key Corp MetLife Morgan Stanley New York Life Principal RBC Regions Bank Scotia SunTrustToronto Dominion US Ex-Im Wells Fargo Europe ABN Amro Airbus Bank Allied Irish Bank AKA Barclays BLBBNP Paribas Bank of Ireland CIC Commerzbank Credit Agricole Credit Suisse Dekabank Deutsche Bank DVB European ECAs Helaba HSB CING KFW Natixis Nord LB Rabobank RBS Santander Siemens Société Générale Asia Pacific Recent additions to lender group Aozora Bank First Abu Dhabi Bank The Nomura Trust and The Bank of East Asia Fuyo General Lease Co. Banking Co. Bank of Kaohsiung NTT Finance The Gunma Bank Bank of Taiwan Samsung Life Insurance The Hachijuni Bank Shanghai Commercial & Bank SinoPac The Higo Bank Savings Bank Cathay United Bank Hua Nan Commercial Shinkin Central Bank Bank The Shizuoka Bank CBA CDB The Hyakugo BankSMBC Chailease Finance (B.V.I) Co. ICBC SMTB Industrial Bank of Korea State Bank of India Chang Hwa Bank China Merchants Bank Industrial Bank of Taiwan Taichung Commercial The Chiba Bank The Iyo Bank BankTaipei Fubon Bank The Chugoku Bank The Joyo Bank Taishin International CCB KEB Hana Bank Bank CTBC Bank KGI Bank Taiwan Business Bank Development Bank of Japan Korea Development Bank Taiwan Cooperative Land Bank of Taiwan Bank DBS Bank Taiwan Shin KongMega ICBC Commercial Bank E.SUN Commercial Bank Mizuho The Tokyo Star Bank Ex-Im Bank of ROC MUFG Yuanta Commercial First Commercial Bank of Taiwan National Australia Bank Bank Woori Bank 47
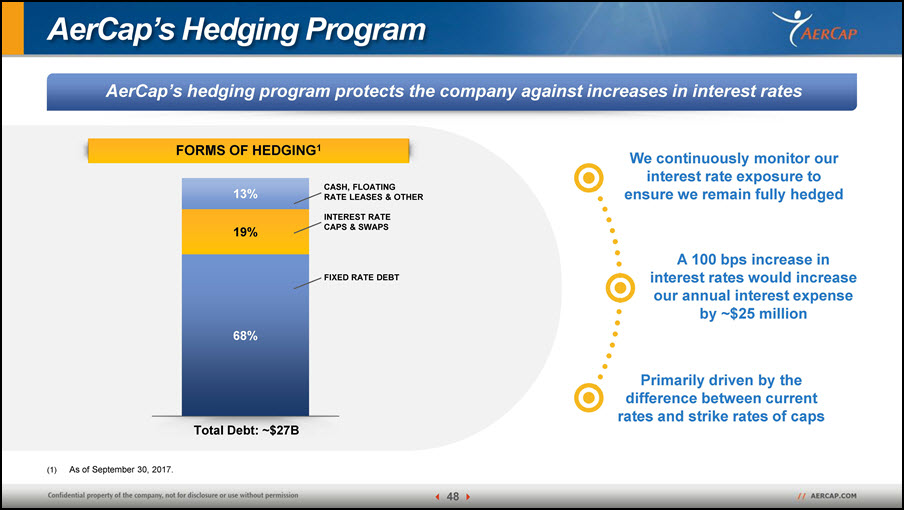
AerCap’s Hedging Program (1) As of September 30, 2017. FORMS OF HEDGING1 68% 19% 13% INTEREST RATE CAPS & SWAPS CASH, FLOATINGRATE LEASES & OTHER FIXED RATE DEBT Total Debt: ~$27B We continuously monitor our interest rate exposure to ensure we remain fully hedged A 100 bps increase in interest rates would increase our annual interest expense by ~$25 million Primarily driven by the difference between current rates and strike rates of caps AerCap’s hedging program protects the company against increases in interest rates 48
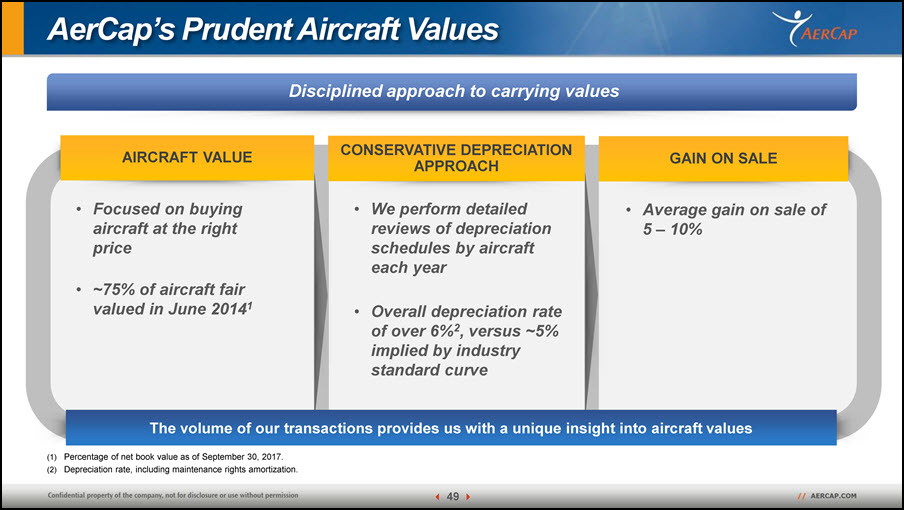
AerCap’s Prudent Aircraft Values Disciplined approach to carrying values Focused on buying aircraft at the right price ~75% of aircraft fair valued in June 20141 AIRCRAFT VALUE GAIN ON SALE Average gain on sale of 5 – 10% We perform detailed reviews of depreciation schedules by aircraft each year Overall depreciation rate of over 6%2, versus ~5% implied by industry standard curve CONSERVATIVE DEPRECIATION APPROACH (1) Percentage of net book value as of September 30, 2017. The volume of our transactions provides us with a unique insight into aircraft values (2) Depreciation rate, including maintenance rights amortization. 49
Financial Outlook
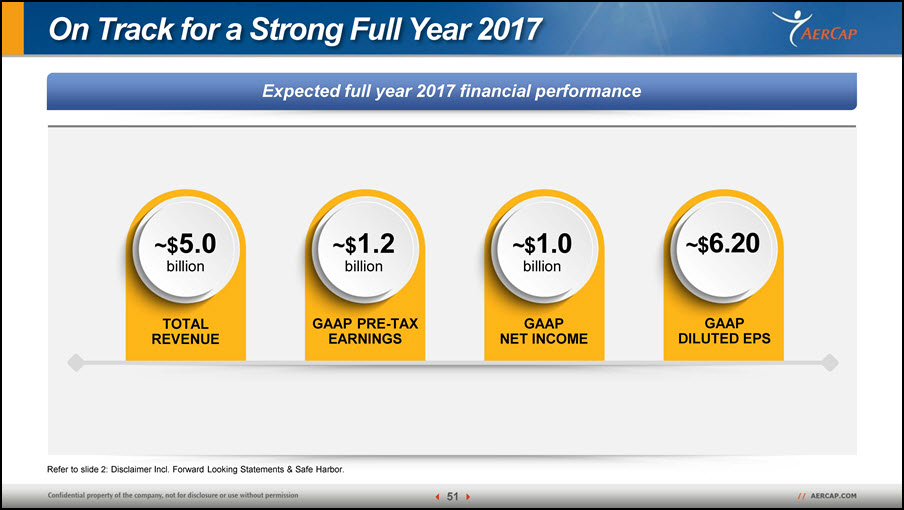
Expected full year 2017 financial performance On Track for a Strong Full Year 2017 TOTAL REVENUE ~$5.0billion ~$1.2billion GAAP PRE-TAXEARNINGS ~$1.0billion GAAPNET INCOME ~$6.20 GAAP DILUTED EPS Refer to slide 2: Disclaimer Incl. Forward Looking Statements & Safe Harbor. 51
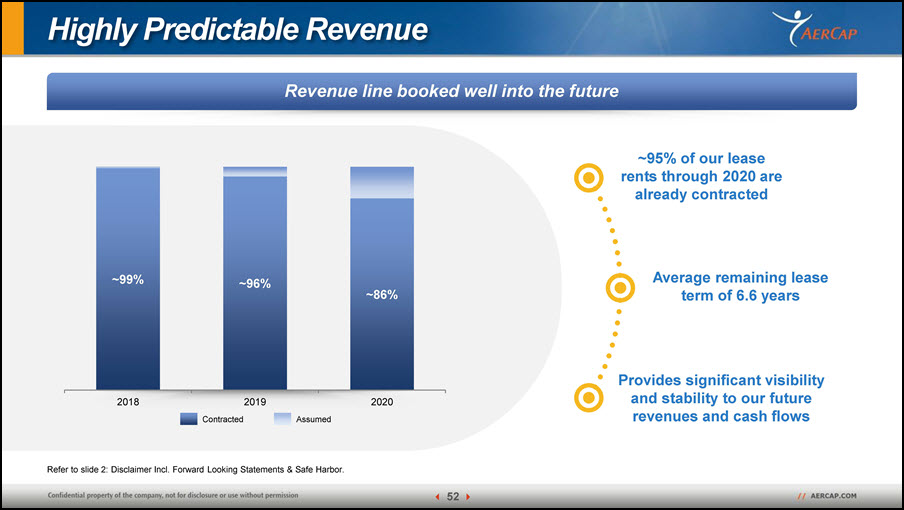
Highly Predictable Revenue Revenue line booked well into the future ~95% of our lease rents through 2020 are already contracted Average remaining leaseterm of 6.6 years Provides significant visibility and stability to our future revenues and cash flows ~99% ~96% ~86% 2018 2019 2020 Assumed Refer to slide 2: Disclaimer Incl. Forward Looking Statements & Safe Harbor. 52 Contracted
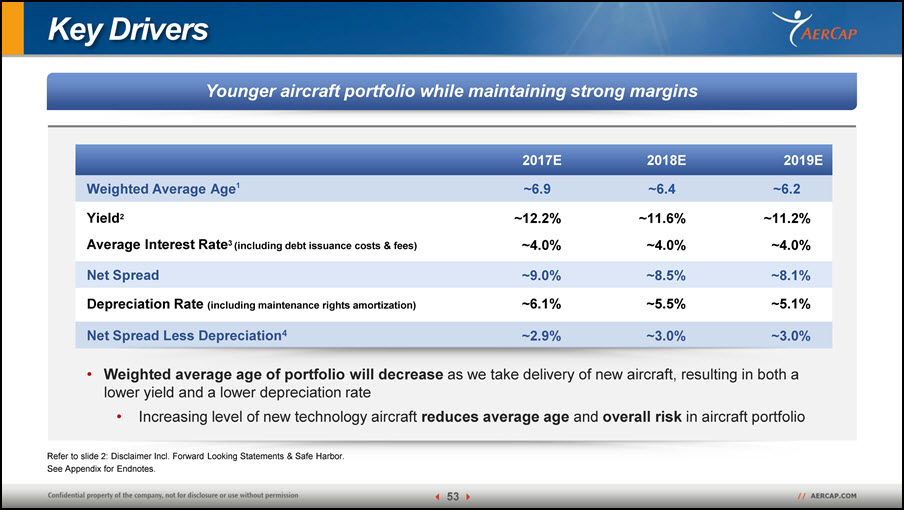
Younger aircraft portfolio while maintaining strong margins Key Drivers 2017E 2018E 2019E Weighted Average Age1 ~6.9 ~6.4 ~6.2 Yield2 ~12.2% ~11.6% ~11.2% Average Interest Rate3 (including debt issuance costs & fees) ~4.0% ~4.0% ~4.0% Net Spread ~9.0% ~8.5% ~8.1% Depreciation Rate (including maintenance rights amortization) ~6.1% ~5.5% ~5.1% Net Spread Less Depreciation4 ~2.9% ~3.0% ~3.0% Refer to slide 2: Disclaimer Incl. Forward Looking Statements & Safe Harbor. See Appendix for Endnotes. 53 Weighted average age of portfolio will decrease as we take delivery of new aircraft, resulting in both a lower yield and a lower depreciation rateIncreasing level of new technology aircraft reduces average age and overall risk in aircraft portfolio
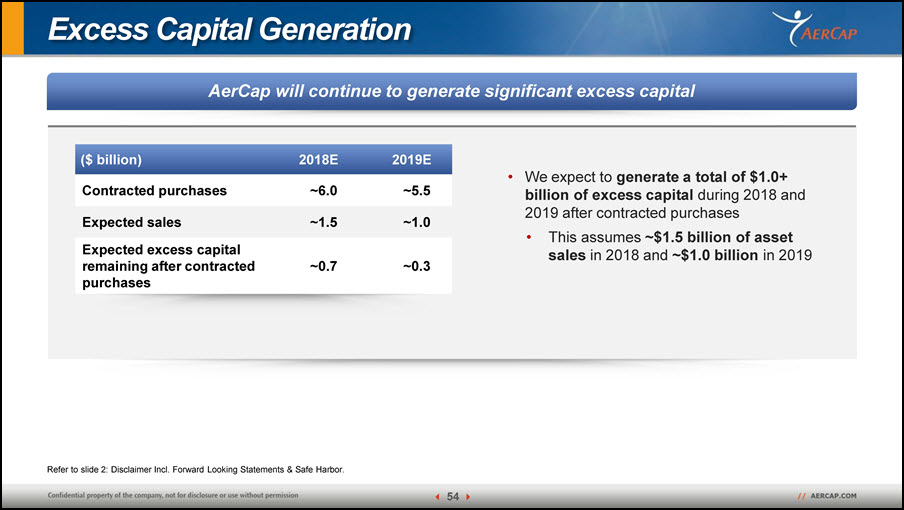
AerCap will continue to generate significant excess capital Excess Capital Generation ($ billion) 2018E 2019E Contracted purchases ~6.0 ~5.5 Expected sales ~1.5 ~1.0 Expected excess capital remaining after contracted purchases ~0.7 ~0.3 Refer to slide 2: Disclaimer Incl. Forward Looking Statements & Safe Harbor. 54 We expect to generate a total of $1.0+ billion of excess capital during 2018 and 2019 after contracted purchasesThis assumes ~$1.5 billion of asset sales in 2018 and ~$1.0 billion in 2019
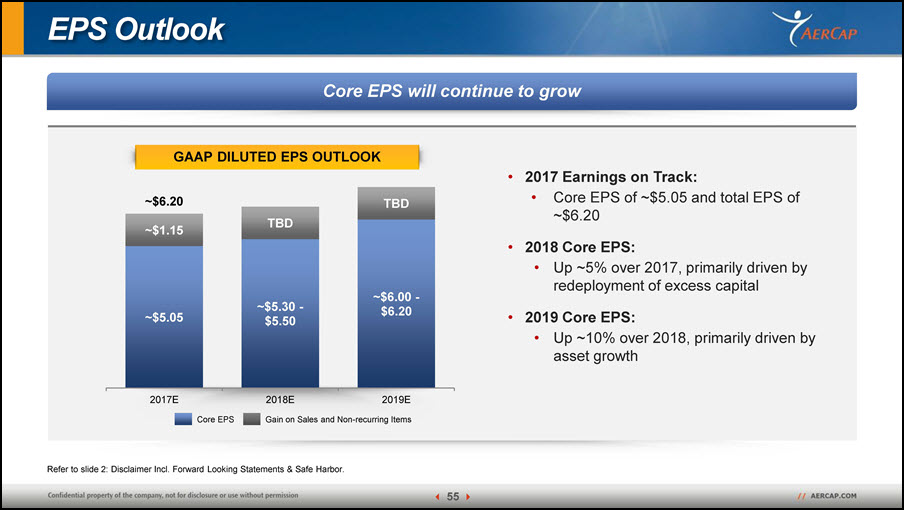
EPS Outlook Core EPS ~$5.05 ~$5.30 -$5.50 ~$6.00 -$6.20 ~$1.15 TBD TBD ~$6.20 2017E 2018E 2019EGain on Sales and Non-recurring Items GAAP DILUTED EPS OUTLOOK Core EPS will continue to grow Refer to slide 2: Disclaimer Incl. Forward Looking Statements & Safe Harbor. 55 2017 Earnings on Track: Core EPS of ~$5.05 and total EPS of~$6.20 2018 Core EPS:Up ~5% over 2017, primarily driven by redeployment of excess capital 2019 Core EPS:Up ~10% over 2018, primarily driven by asset growth
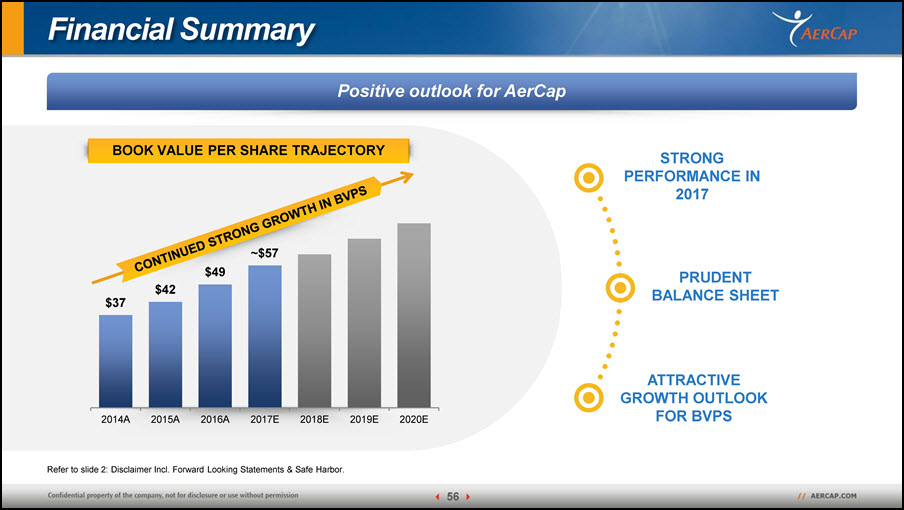
Financial Summary Positive outlook for AerCap BOOK VALUE PER SHARE TRAJECTORY $37 $42 $49 ~$57 2014A 2015A 2016A 2017E 2018E 2019E 2020E STRONG PERFORMANCE IN 2017 Refer to slide 2: Disclaimer Incl. Forward Looking Statements & Safe Harbor. 56 PRUDENTBALANCE SHEET ATTRACTIVE GROWTH OUTLOOK FOR BVPS
Closing Remarks RELENTLESS EXECUTION INVESTMENT DISCIPLINE CONSISTENT PROFITABILITY LEVERAGING SCALE VALUE CREATION 57
Q&A
Appendix
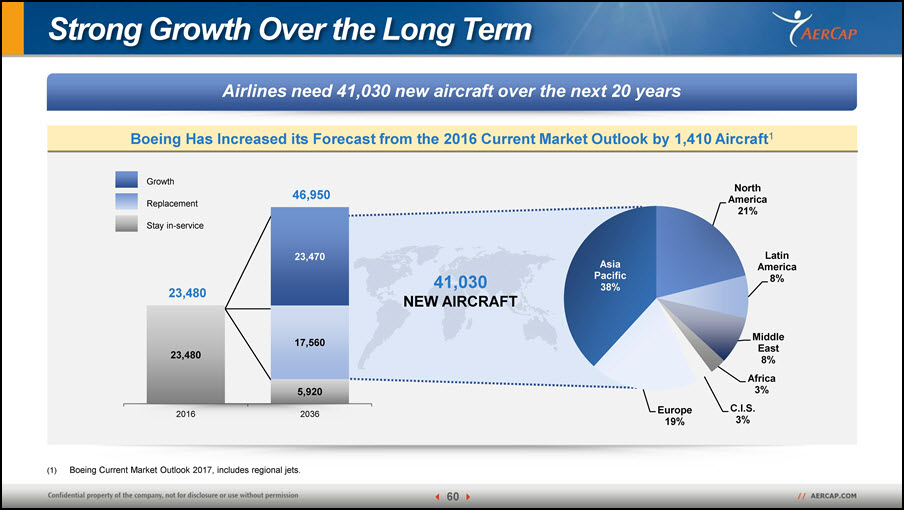
Strong Growth Over the Long Term Airlines need 41,030 new aircraft over the next 20 yearsBoeing Has Increased its Forecast from the 2016 Current Market Outlook by 1,410 Aircraft1 (1) Boeing Current Market Outlook 2017, includes regional jets. Stay in-service Replacement Growth 41,030NEW AIRCRAFT North America 21% Latin America 8% Middle East 8%Africa 3%C.I.S. 3% Europe 19% Asia Pacific 38% 23,480 5,920 17,560 23,470 23,480 46,950 2016 2036 60
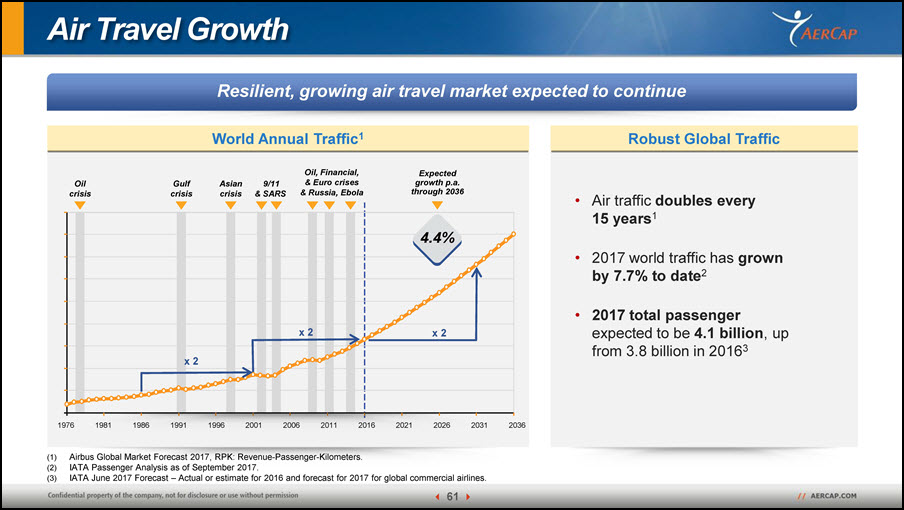
Air Travel Growth Resilient, growing air travel market expected to continueRobust Global Traffic Airbus Global Market Forecast 2017, RPK: Revenue-Passenger-Kilometers.IATA Passenger Analysis as of September 2017.IATA June 2017 Forecast – Actual or estimate for 2016 and forecast for 2017 for global commercial airlines. World Annual Traffic1 Oil crisis1976 1981 1986 Gulf crisis1991 Asian crisis1996 Oil, Financial,9/11 & Euro crises& SARS & Russia, Ebola2001 2006 2011 2016 Expected growth p.a. through 20362021 2026 2031 2036 4.4% x 2 x 2 x 2 Air traffic doubles every 15 years12017 world traffic has grown by 7.7% to date22017 total passenger expected to be 4.1 billion, up from 3.8 billion in 20163 61
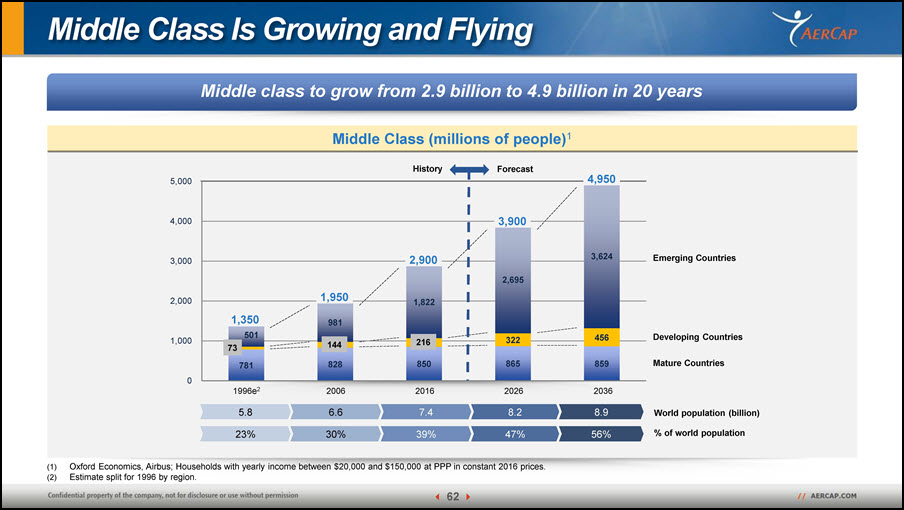
Middle Class Is Growing and Flying Middle class to grow from 2.9 billion to 4.9 billion in 20 years 456 322 501 981 1,822 2,695 3,624 1,000 2,000 3,000 4,000 5,000 1,950 144 1,350 2,900 216 73 Emerging Countries Developing Countries 4,950 3,900 781 828 850 865 859 Mature Countries 0 1996e2 2006 2016 2026 2036 5.8 6.6 7.4 8.2 8.9 World population (billion) 23% 30% 39% 47% 56% % of world population Middle Class (millions of people)1History Forecast (2) Estimate split for 1996 by region. 62 (1) Oxford Economics, Airbus; Households with yearly income between $20,000 and $150,000 at PPP in constant 2016 prices.
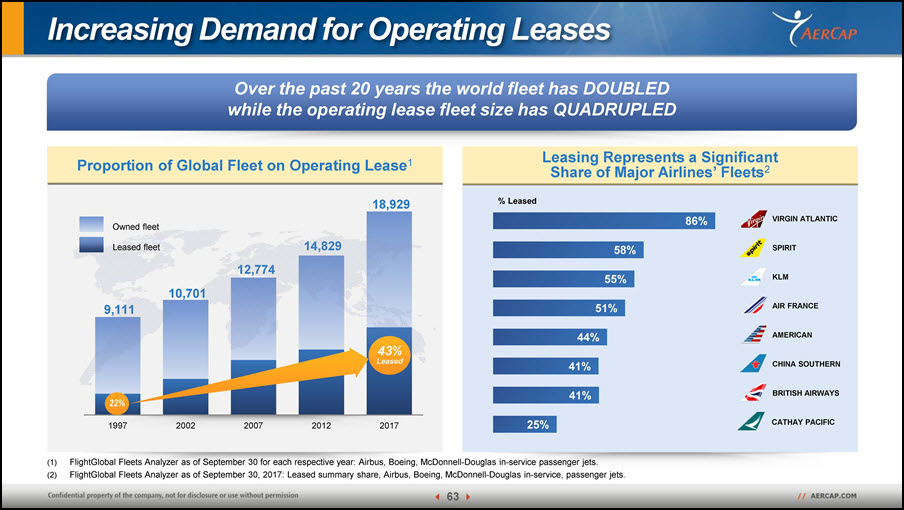
Leasing Represents a Significant Share of Major Airlines’ Fleets2 Increasing Demand for Operating Leases Over the past 20 years the world fleet has DOUBLED while the operating lease fleet size has QUADRUPLED Proportion of Global Fleet on Operating Lease1 9,111 10,701 12,774 14,829 18,929 2002 2007 2012 2017 Owned fleetLeased fleet 22%1997 43%Leased % Leased 25% 41% 41% 44% 51% 55% 58% 86% VIRGIN ATLANTIC SPIRIT KLM AIR FRANCE AMERICAN CHINA SOUTHERN BRITISH AIRWAYS CATHAY PACIFIC (1) FlightGlobal Fleets Analyzer as of September 30 for each respective year: Airbus, Boeing, McDonnell-Douglas in-service passenger jets. (2) FlightGlobal Fleets Analyzer as of September 30, 2017: Leased summary share, Airbus, Boeing, McDonnell-Douglas in-service, passenger jets. 63
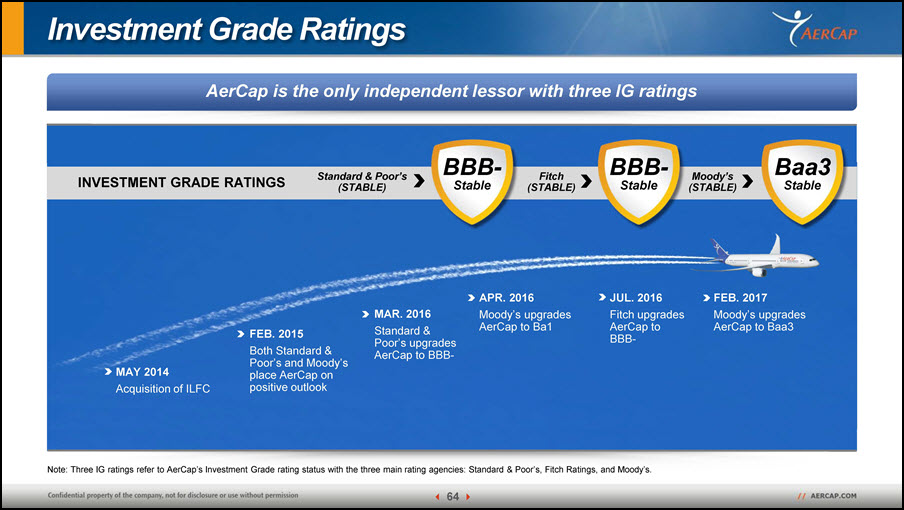
Investment Grade Ratings AerCap is the only independent lessor with three IG ratings MAY 2014Acquisition of ILFC FEB. 2015Both Standard &Poor’s and Moody’s place AerCap on positive outlook MAR. 2016Standard &Poor’s upgrades AerCap to BBB- APR. 2016Moody’s upgrades AerCap to Ba1 JUL. 2016Fitch upgrades AerCap to BBB- FEB. 2017Moody’s upgrades AerCap to Baa3 Standard & Poor’s (STABLE) Fitch (STABLE) INVESTMENT GRADE RATINGS Moody’s (STABLE) BBB- Stable Baa3 Stable BBB- 64 Stable Note: Three IG ratings refer to AerCap’s Investment Grade rating status with the three main rating agencies: Standard & Poor’s, Fitch Ratings, and Moody’s.
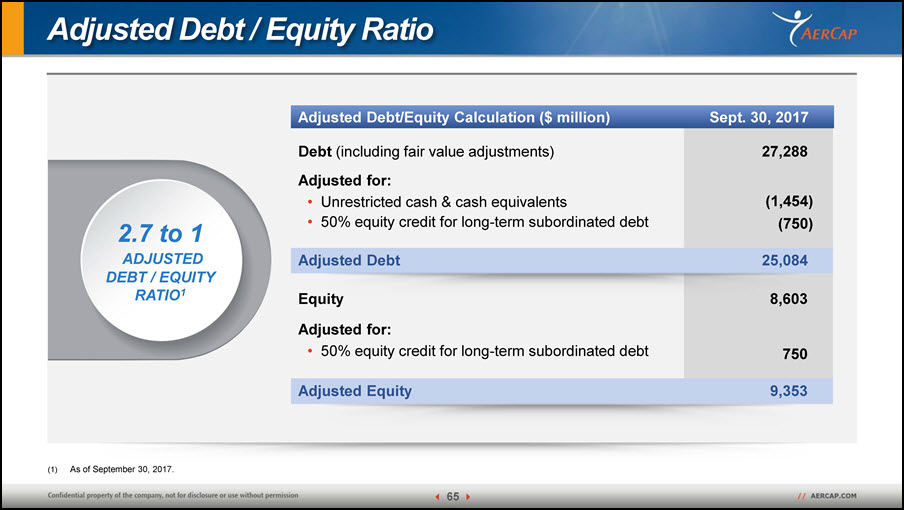
Adjusted Debt / Equity Ratio 2.7 to 1ADJUSTED DEBT / EQUITY RATIO1 27,288 Debt (including fair value adjustments)Adjusted for:Unrestricted cash & cash equivalents50% equity credit for long-term subordinated debt (1,454)(750) Adjusted Debt 25,084 8,603 EquityAdjusted for:50% equity credit for long-term subordinated debt 750 Adjusted Equity 9,353 Adjusted Debt/Equity Calculation ($ million) Sept. 30, 2017 (1) As of September 30, 2017. 65
Endnotes 66 SLIDE 16: Growing Industry Airbus Global Market Forecast 2017-2036; Boeing Current Market Outlook 2017. Oxford Economics, Airbus; Yearly household income $20,000-$150,000. Flight Global Fleets Analyzer as of September 30 for each respective year: Airbus, Boeing, McDonnell-Douglas in-service passenger jets.SLIDE 24: 777 Aircraft Continue to be Placed Scheduled expiries as of December 31, 2014. Required placements as per our 4Q 2015 financial results presentation Required placements as of December 31, 2016. Placed aircraft include released, extended, sold or to be parted-out either under a contract or letter of intent as of October 20, 2017. SLIDE 30: Portfolio Transformation As of June 30, 2014; September 30, 2017; December 31, 2021, respectively. Incl. maintenance rights intangible & net investment in finance and sales-type leases. Refer to slide 2: Disclaimer Incl. Forward Looking Statements & Safe Harbor.1. Widebody: 777s, A330s; Out-of-production aircraft: 757s, 767s, 737 classics, CRJ, MD-11, 747s, A340s, A310s. SLIDE 33: Aircraft Trading Results As of September 30, 2017. Owned aircraft sold including sales and reclassifications to finance and sales-type leases. As of September 30, 2017. Owned aircraft sold excluding sales and reclassifications to finance and sales-type leases. SLIDE 53: Key Drivers SLIDE 36: Are Supply and Demand Balanced? FlightGlobal Fleets Analyzer as of October 27, 2017: Airbus, Boeing, McDonnell-Douglas in-service, on order and in-storage passenger jets.Utilization YTD as of September 30, 2017. Placements as of September 30, 2017.IATA Passenger Analysis as of September 2017.IATA Industry Statistics June 2017 – actual for 2015 and 2016, forecast for 2017 for system-wide global commercial airlines. SLIDE 42: Improved Debt / Equity Ratio1. Adjusted Debt/equity ratios are calculated by dividing adjusted debt by adjusted equity. Adjusted debt is calculated as follows: debt less cash and cash equivalents, less 50% equity credit for long-term subordinated debt. Adjusted equity is calculated as follows: total equity plus 50% equity credit for long-term subordinated debt. SLIDE 44: Track Record of Returning Capital to Shareholders Sourced from CapitalQ; reflects AerCap rank relative to S&P 500 constituents as of May 4, 2017. As of September 30, 2017. Age at year-end. Basic lease rents divided by average book value of flight equipment, net investment in finance and sales type leases and maintenance rights intangible.Interest expense including fair value amortization divided by average debt, including debt fair value. Depreciation rate including maintenance rights amortization.
AerCap Holdings N.V. AerCap House 65 St. Stephen’s Green Dublin 2, Ireland+ 353 1 819 2010 contact@aercap.com Follow us on